More than a week after Donald Trump departed the White House, shattering their hopes that he would expose the worldwide cabal, some QAnon adherents have concocted ever more elaborate stories to keep their faith alive. But others like Smith are turning to therapy and online support groups to talk about the damage done when beliefs collide with reality.
This study examined the problem of news distrust in a new way. We tested whether trust or distrust in a news outlet can be cued at the “domain level” — alongside search information about the news outlet — rather than beside or within a specific story. To do this, we used information about the news outlet — signals — that could be shown in a sidebar called a Knowledge Panel7 when people do a Google search for that news outlet. We conducted one experiment in the U.S. and Germany, and another in the U.S., Germany, and Brazil. We used multiple countries in order to determine how trust signals work across different cultures with varying levels of news trust.8 The Google News Initiative funded this research.
In our forthcoming book, You Are Here, Ryan Milner and I explain the limitations of focusing on obvious sources of harm within the information ecosystem. To do this, we use biomass pyramids—diagrams that visually represent the cumulative weight and population size of various organisms within the same ecosystem. Apex predators—the lions, tigers, and bears—are at the very top of the pyramid. There are fewer of them, and as a result their cumulative weight is often relatively low, but they pose outsized threats to the rest of the ecosystem. At the same time, they are utterly dependent on all the lower strata. Take away their prey, take away their prey’s prey, take away the ecological conditions that sustain the biomass, and the lions and tigers and bears don’t have a chance.
Book:
More conclusions. I am not going in the direction that I thought when I started writing.
GOES
Verifying that everything still works after checking out Vadim’s changes. Nope, things are very wrong.
I think I fixed the physics step by making it the calculated time, but the ReactionWheelController needs to be updated to take the scaled_dclock values
Update TopController – not yet, I guess
2:00 customer meeting
MDS
Ok, back to figuring out intersections while I wait for Vadim
Ok, so we’re still in the middle of a pandemic, it looks like around 400 people might be charged with sedition for the Jan 6 attack on the Capitol, and the GOP doesn’t want to have anything to do with impeachment, but the crazy seems to be much lower.
Vaccines are rolling out, and we’ll probably be at closer to 200M vaccinations by April. The government appears to be doing things again. It feels like we are past the turning point in whatever metaphor you’d like to use here, and now entering the mopping up phase.
What America needs instead is a creative, comprehensive effort by both the private sector and the government to disincentivize conspiracies and misinformation on the many platforms on which they flourish. Some social media companies have begun this work, clearing out QAnon sites and banning some far-right and White power users and communities who pose a threat. That work needs to continue, with careful attention to the biggest offenders who game algorithms and media structures to spread misinformation. But sources of misinformation also need to be demonetized, whether they are YouTube channels or national cable networks, and algorithms tweaked to slow down the spread of extreme content.
Book
More conclusions. I’m tempted to look at antisemitism through the dominance hierarchy lens. To show that if you truly feel that you are at the top of the hierarchy (just under your God), and use the Bible as the scaffolding for that understanding, then the fact that the same bible says that the Jews are chosen by God must really require some mental gymnastics. And for some, those gymnastics lead to genocide, since once the Jews are gone, then there is no one between you and God, and the rightful order is restored.
I think this is related to slavery and racism in the US. To be able to treat people as property requires that they be less than people, otherwise dominance makes no sense. The hierarchy of God -> slave holder -> slave justifies any dominance behavior. And in the end the mental gymnastics that are required for that are the same as those required by anti-Semites. These are both co-created fictional social realities that exist in the communities that believe themselves righteously superior to those they oppress. And as we now understand, that process of creating hierarchical social realities can often stampede to the worst possible places.
NOAA
SEVEN trainings by Feb 1! But I can’t get to my email, so that’s going nowhere
GOES
11:00 Meeting with Vadim. He has most of the changes in. Waiting for some final work and then I’ll start rolling in the new TopController
Survey data by @electionstudies shows that extreme opinions wrt different topics can be correlated. We propose a model that reproduces these polarized, ideological opinions, without assuming apriori such correlations or preexisting social structures 1/3 pic.twitter.com/VbJ08ibPTP
Starting conclusions. Going at it from explore/exploit, and why it’s important to have primordial movement, which is the domain of youth
IRAD
Talked to Aaron about using the time for a state switch as part of the input vector, or alternatively doing something like a waterfall CNN-style input to account for time. Didn’t seem to get much traction.
GOES
10:00 Meeting with Vadim. I think we worked through the issues. 11:00 meeting tomorrow to discuss
Something’s wrong with ScriptReaderScratch – fixing
We are making publicly available VoterFraud2020, a multi-modal Twitter dataset with 7.6M tweets and 25.6M retweets from 2.6M users that includes key phrases and hashtags related to voter fraud claims between October 23rd and December 16th. The dataset also includes the full set of links and YouTube videos shared in these tweets, with data about their spread in different Twitter sub-communities. Key takeaways from our initial analysis of the data are listed below.
Going to try this with numpy.roots, which work exactly the way you would want them to do.
One shortcut did occur to me. I just need to determine when velocity is zero and use 2t to figure out what the range will be. I can then use that knowledge to place the source.
Not much time to work on it this morning, but added some text about Stephens’ neural coupling. Tomorrow I’ll talk about the agents a bit and in particular how increasing dimensions makes it harder to have a stampede
There have been countless fact-checking and other efforts designed to rid social media of misinformation. They’re not going to work until the party and the major ideological amplifiers start explicitly renouncing these points of view. The signs are not good – while Fox News was willing to declare that Joe Biden had won the election, they are still providing platforms for people denying the facts of the victory. And a majority of Republican representatives voted to overturn a democratic election. Until there are consequences for perpetuating those falsehoods, don’t count on changes to the media to solve this problem
Twitter’s January 8 decision to permanently suspend Trump’s account closed a rare window into a president’s mindset and policymaking that we are unlikely to ever see again. For the past four years, I documented the sources of the president’s grievances and obsessions, matching Trump’s tweets to the television segments he was watching. The president’s TV addiction inspired at least 1,375 tweets dating back to September 1, 2018. The vast majority came in response to his favorite programs on the pro-Trump Fox News and Fox Business networks.
But if there ever was a coda for the Trump years, this has got to be it:
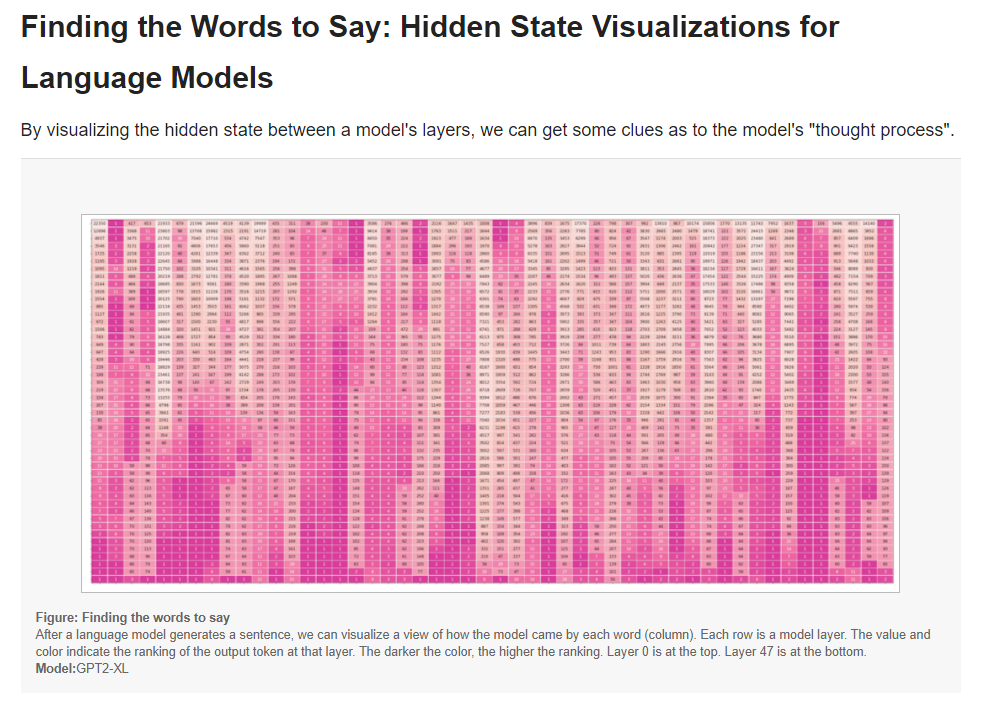
In this article, we will focus on the hidden state as it evolves from model layer to the next. By looking at the hidden states produced by every transformer decoder block, we aim to gleam information about how a language model arrived at a specific output token. This method is explored by Voita et al.[1]. Nostalgebraist [2] presents compelling visual treatments showcasing the evolution of token rankings, logit scores, and softmax probabilities for the evolving hidden state through the various layers of the model.
The 2020 U.S. Presidential Election saw an unprecedented number of false claims alleging election fraud and arguing that Donald Trump was the actual winner of the election. Here we report a survey exploring belief in these false claims that was conducted three days after Biden was declared the winner. We find that a majority of Trump voters in our sample – particularly those who were more politically knowledgeable and more closely following election news – falsely believed that election fraud was widespread, and that Trump won the election. Thus, false beliefs about the election are not merely a fringe phenomenon. We also find that Trump conceding or losing his legal challenges would likely lead a majority of Trump voters to accept Biden’s victory as legitimate, although 40% said they would continue to view Biden as illegitimate regardless. Finally, we found that levels of partisan spite and endorsement of violence were equivalent between Trump and Biden voters.
MDS
Meeting with Aaron today to discuss nest steps and how to combine with his project?
Still need to be able to access the VPN – more paperwork. Wheee!
GOES
Continue with the new TopController
Reading in and stepping through the script. Now I need to slew through the points and return a done when the l2 dist is within a threshold
If you use the Hugging Face Trainer, as of transformers v4.2.0 you have the experimental support for DeepSpeed’s and FairScale’s ZeRO features. The new --sharded_ddp and --deepspeed command line Trainer arguments provide FairScale and DeepSpeed integration respectively. Here is the full documentation.
The thing is, contemporary Hasidic sects are designed for authoritarian control. Each Hasidic sect, from Bobov to Viznitz to Satmar to Skver, are run by what is called a “grand rabbi.” These rabbis are demanding patriarchs. They expect women to wear particular shades of stockings, men to dress identically, congregants to receive their blessings before making any personal life decisions, and they believe in a world where Hasids are the only Jews worth mentioning. Most importantly, Hasidic grand rabbis center their congregants’ worlds around themselves. They are populist leaders of miniature nations. Congregants have paintings and photographs of grand rabbis around their homes, sacrifice family time for tisches (Friday night gatherings) with their leaders, and would do anything to protect the power of their particular grand rabbi.
Book
Working on Making better Human-Computer Interfaces for Populations. Finished my first pass at The signature of dangerous misinformation section
2:00 Meeting with Michelle
GOES
Decided to build out a sandbox ScriptReaderScratch RCS controller to work out the file loading and playback. Rather than AngleController, I’ll have a method that interpolates to the newest target. That should be enough to let me work out the details without breaking anything
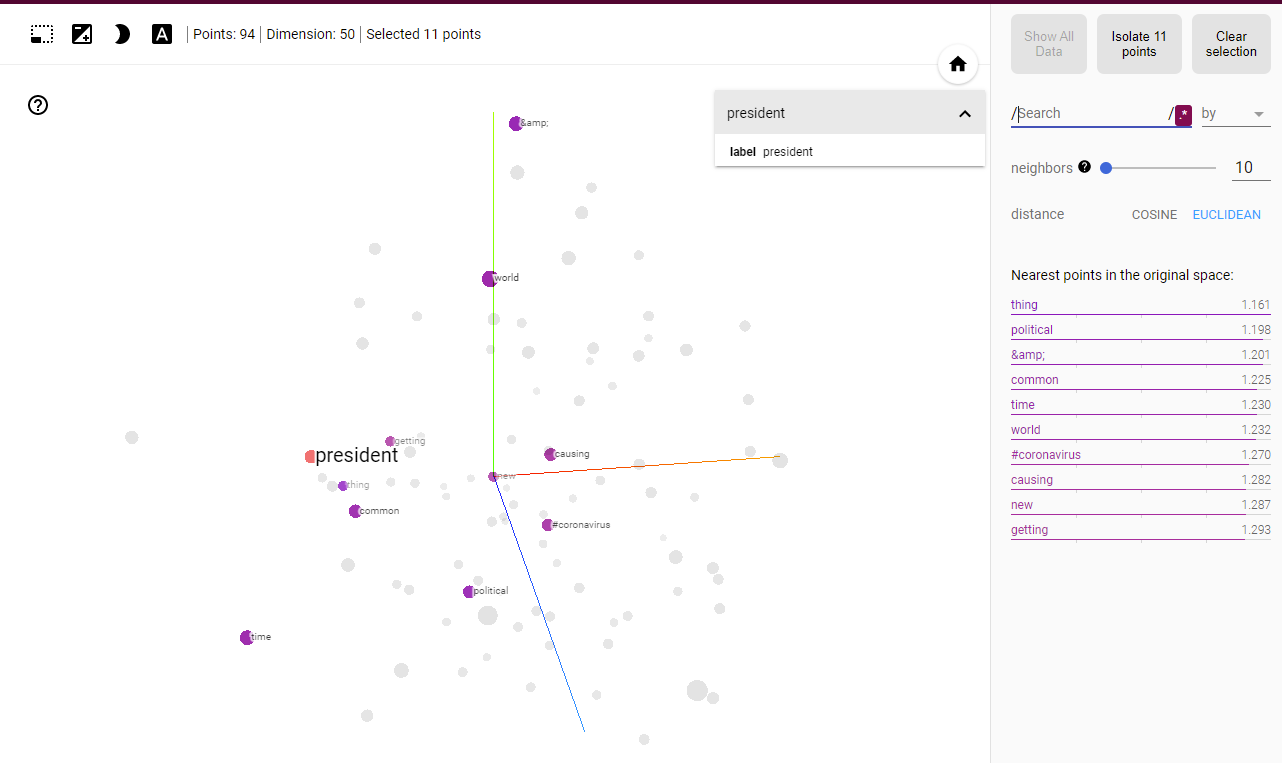
ParametricUMAP allows users to train a neural network to optimize the embedding, resulting in a direct neural net based mapping from source data to embedding. This allows for extremely fast inference (embedding of new data points), orders of magnitude faster than standard UMAP. It also provides facilities for an inverse transform, mapping from the embedding space to the original data space that is both far faster and more robust that that provided by standard UMAP. Since network architectures can be user provided this also allows for CNN and RNN based UMAP embeddings for images or sequences.
Book
Continue Making better Human-Computer Interfaces for Populations
GOES
Add in mapping to script reader, verify by adding legends
MDS
Status meeting maybe produce a spreadsheet to walk through that shows a time series of inputs and a calculation for each set? I think the inputs can be a column of six (for now?) variables as a set of rows, and the prediction calculations are shown below that. Make a DataFrame and see what that looks like.
The playbook for the Maga invasion of the nation’s Capitol building on Wednesday has been developing for years in plain sight, at far-right rallies in cities like Charlottesville, Berkeley and Portland, and then, in the past year, at state capitols across the country, where heavily armed white protesters have forced their way into legislative chambers to accuse politicians of tyranny and treason.
Here’s what seems to have happened with the Parler hack. The data may be available for research
Nice paper on training a model to generate synthetic data for better classification training: Reducing AI bias with Synthetic data. It uses the gretel’s gretel-synthetics library It’s free to use during the beta period, not sure about after, or what the pricing will be. They are hiring, with about seven openings at the moment, so they are burning through someone’s money.
GPT Agents
Finish abstract submission – done
Make an Overleaf project for qualitative paper?
GOES
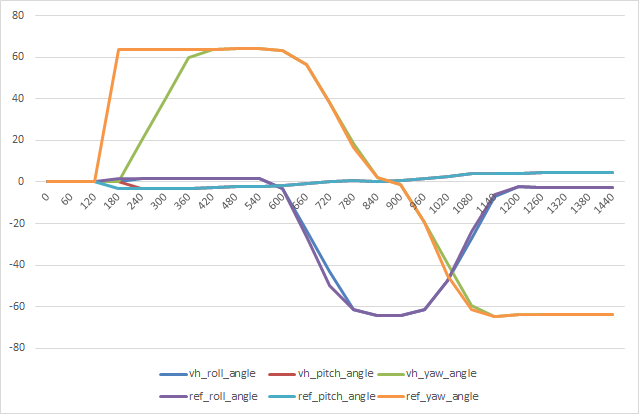
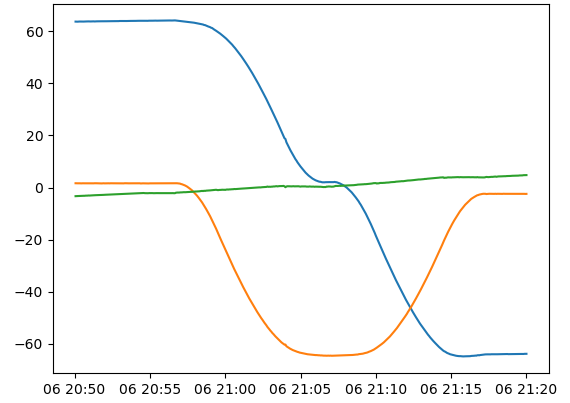
Finish up the ManeuverReader – done! Here’s the original, with some large number of points that is subsampled to 100 points and stored as a json file
Here’s a reconstructed version that uses 1/3 (33) steps through the file. You can see a little roughness, but with more points it’s indistinguishable from the original pulled off influxDB:


You must be logged in to post a comment.