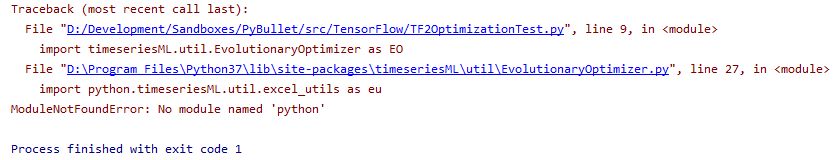
There was some initial trickiness in getting the IDE to work with the TF2.0 RC0 package:
import tensorflow as tf
from tensorflow import keras
from tensorflow_core.python.keras import layers
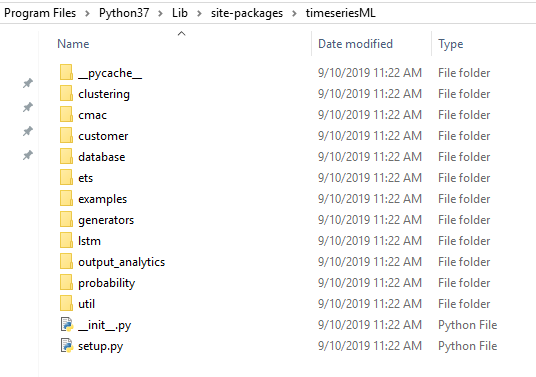
The first coding step was to generate the data. In this case I’m building a numpy matrix that has ten variations on math.sin(), using our timeseriesML utils code. There is a loop that sets up the code to create a new frequency, which is sent off to get back a pandas Dataframe that in this case has 10 sequence rows with 100 samples. First, we set the global sequence_length:
sequence_length = 100
then we create the function that will build and concatenate our numpy matrices:
def generate_train_test(num_functions, rows_per_function, noise=0.1) -> (np.ndarray, np.ndarray, np.ndarray):
    ff = FF.float_functions(rows_per_function, 2*sequence_length)
    npa = None
    for i in range(num_functions):
        mathstr = "math.sin(xx*{})".format(0.005*(i+1))
        #mathstr = "math.sin(xx)"
        df2 = ff.generateDataFrame(mathstr, noise=0.1)
        npa2 = df2.to_numpy()
        if npa is None:
            npa = npa2
        else:
            ta = np.append(npa, npa2, axis=0)
            npa = ta

    split = np.hsplit(npa, 2)
    return npa, split[0], split[1]
Now, we build the model. We’re using keras from the TF 2.0 RC0 build, so things look slightly different:
model = tf.keras.Sequential()
# Adds a densely-connected layer with 64 units to the model:
model.add(layers.Dense(sequence_length, activation='relu', input_shape=(sequence_length,)))
# Add another:
model.add(layers.Dense(200, activation='relu'))
# Add a softmax layer with 10 output units:
model.add(layers.Dense(sequence_length))

loss_func = tf.keras.losses.MeanSquaredError()
opt_func = tf.keras.optimizers.Adam(0.01)
model.compile(optimizer= opt_func,
              loss=loss_func,
              metrics=['accuracy'])
We can now fit the model to the generated data:
full_mat, train_mat, test_mat = generate_train_test(10, 10)

model.fit(train_mat, test_mat, epochs=10, batch_size=2)
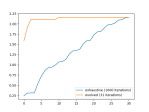
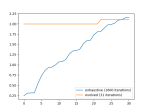
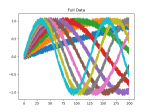
There is noise in the data, so the accuracy is not bang on, but the loss is nice. We can see this better in the plots above, which were created using this function:
def plot_mats(mat:np.ndarray, cluster_size:int, title:str, fig_num:int):
    plt.figure(fig_num)

    i = 0
    for row in mat:
        cstr = "C{}".format(int(i/cluster_size))
        plt.plot(row, color=cstr)
        i += 1

    plt.title(title)
Which is called just before the program completes:
if show_plots:
plot_mats(full_mat, 10, "Full Data", 1)
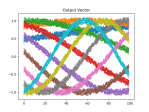
plot_mats(train_mat, 10, "Input Vector", 2)
plot_mats(test_mat, 10, "Output Vector", 3)
plot_mats(predict_mat, 10, "Predict", 4)
plt.show()


You must be logged in to post a comment.