Monthly Archives: January 2019

Phil 1.30.19

7:00 – 4:00 ASRC IRAD
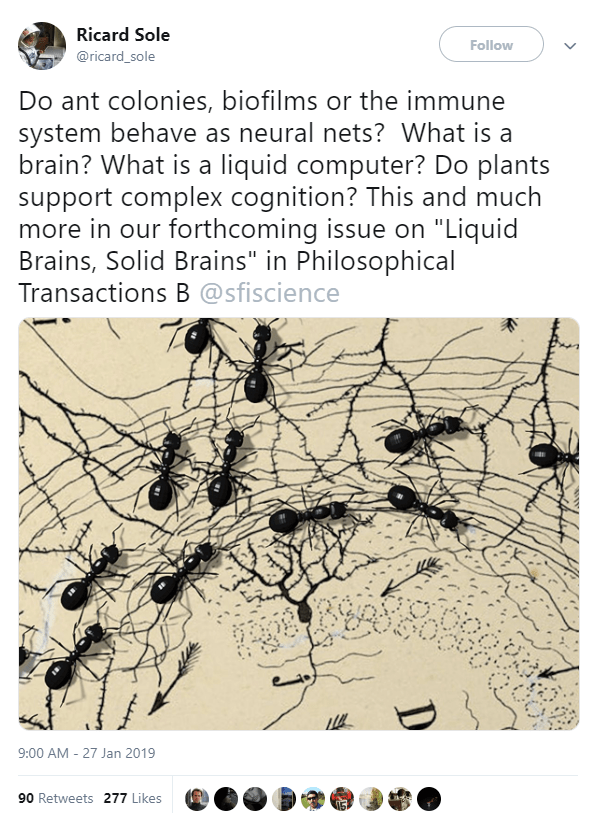
Teaching a neural network to drive a car. It’s a simple network with a fixed number of hidden nodes (no NEAT), and no bias. Yet it manages to drive the cars fast and safe after just a few generations. Population is 650. The network evolves through random mutation (no cross-breeding). Fitness evaluation is currently done manually as explained in the video.

  • This interactive balance between evolution and learning is exactly the sort of interaction that I think should be at the core of the research browser. The only addition is the ability to support groups collaboratively interacting with the information so that multiple analysts can train the system.
  • A quick thing on the power of belief spaces from a book review about, of all things, Hell. One of the things that gives dimension to a belief space is the fact that people show up.
    • Soon, he’d left their church and started one of his own, where he proclaimed his lenient gospel, pouring out pity and anger for those Christians whose so-called God was a petty torturer, until his little congregation petered out. Assured salvation couldn’t keep people in pews, it turned out. The whole episode, in its intensity and its focus on the stakes of textual interpretation, was reminiscent of Lucas Hnath’s recent play “The Christians,” about a pastor who comes out against Hell and sparks not relief but an exegetical nightmare.
  • Web Privacy Measurement in Real-Time Bidding Systems. A Graph-Based Approach to Rtb System Classification.
    • In the doctoral thesis, Robbert J. van Eijk investigates the advertisements online that seem to follow you. The technology enabling the advertisements is called Real-Time Bidding (RTB). An RTB system is defined as a network of partners enabling big data applications within the organizational field of marketing. The system aims to improve sales by real-time data-driven marketing and personalized (behavioral) advertising. The author applies network science algorithms to arrive at measuring the privacy component of RTB. In the thesis, it is shown that cluster-edge betweenness and node betweenness support us in understanding the partnerships of the ad-technology companies. From our research it transpires that the interconnection between partners in an RTB network is caused by the data flows of the companies themselves due to their specializations in ad technology. Furthermore, the author provides that a Graph-Based Methodological Approach (GBMA) controls the situation of differences in consent implementations in European countries. The GBMA is tested on a dataset of national and regional European news websites.
  • Continuing with Tkinter and ttk
      • That was easy!
        • app3
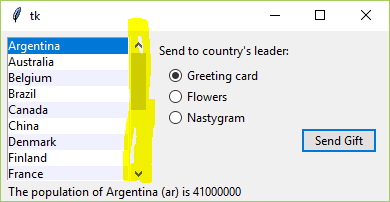
      • And now there is a scrollbar, which is a little odd to add. They are separate components that you have to explicitly link and place in the same ttk.Frame:
    # make the frame for the listbox and the scroller to live in
    self.lbox_frame = ttk.Frame(self.content_frame)
    
    # place the frame 
    self.lbox_frame.grid(column=0, row=0, rowspan=6, sticky=(N,W,E,S))
    
    # create the listbox and the scrollbar
    self.lbox = Listbox(self.lbox_frame, listvariable=self.cnames, height=5)
    lbox_scrollbar = ttk.Scrollbar(self.lbox_frame, orient=VERTICAL, command=self.lbox.yview)
    
    # after both components have been made, have the lbox point at the scroller
    self.lbox['yscrollcommand'] = lbox_scrollbar.set


    • If you get this wrong, then you can end up with a scrollbar in some other Frame, connected to your target. Here’s what happens if the parent is root:
      • badscroller
    • And here is where it’s in the lbox frame as in the code example above:
      • goodscroller
    • The fully formed examples are no more. Putting together a menu app with text. Got the text running with a scrollbar, and everything makes sense. Next is the menus…scrollingtext
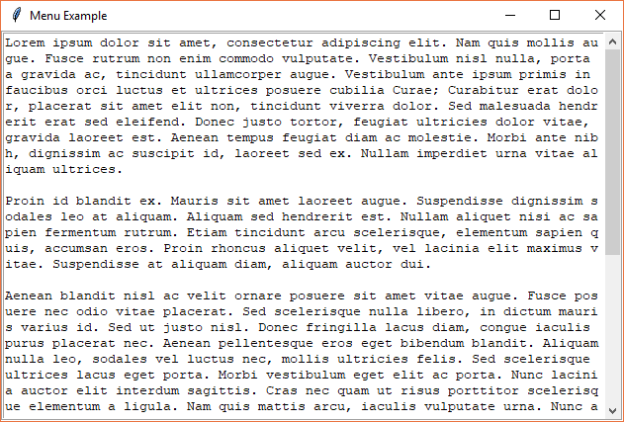
    • Here’s the version of the app with working menus: slackdbio
  • For seminar: Predictive Analysis by Leveraging Temporal User Behavior and User Embeddings
    • The rapid growth of mobile devices has resulted in the generation of a large number of user behavior logs that contain latent intentions and user interests. However, exploiting such data in real-world applications is still difficult for service providers due to the complexities of user behavior over a sheer number of possible actions that can vary according to time. In this work, a time-aware RNN model, TRNN, is proposed for predictive analysis from user behavior data. First, our approach predicts next user action more accurately than the baselines including the n-gram models as well as two recently introduced time-aware RNN approaches. Second, we use TRNN to learn user embeddings from sequences of user actions and show that overall the TRNN embeddings outperform conventional RNN embeddings. Similar to how word embeddings benefit a wide range of task in natural language processing, the learned user embeddings are general and could be used in a variety of tasks in the digital marketing area. This claim is supported empirically by evaluating their utility in user conversion prediction, and preferred application prediction. According to the evaluation results, TRNN embeddings perform better than the baselines including Bag of Words (BoW), TFIDF and Doc2Vec. We believe that TRNN embeddings provide an effective representation for solving practical tasks such as recommendation, user segmentation and predictive analysis of business metrics.

Phil 1.29.19

7:00 – 5:30 ASRC IRAD

  • Theories of Error Back-Propagation in the Brain
    • This review article summarises recently proposed theories on how neural circuits in the brain could approximate the error back-propagation algorithm used by artificial neural networks. Computational models implementing these theories achieve learning as efficient as artificial neural networks, but they use simple synaptic plasticity rules based on activity of presynaptic and postsynaptic neurons. The models have similarities, such as including both feedforward and feedback connections, allowing information about error to propagate throughout the network. Furthermore, they incorporate experimental evidence on neural connectivity, responses, and plasticity. These models provide insights on how brain networks might be organised such that modification of synaptic weights on multiple levels of cortical hierarchy leads to improved performance on tasks.
  • Interactive Machine Learning by Visualization: A Small Data Solution
    • Machine learning algorithms and traditional data mining process usually require a large volume of data to train the algorithm-specific models, with little or no user feedback during the model building process. Such a “big data” based automatic learning strategy is sometimes unrealistic for applications where data collection or processing is very expensive or difficult, such as in clinical trials. Furthermore, expert knowledge can be very valuable in the model building process in some fields such as biomedical sciences. In this paper, we propose a new visual analytics approach to interactive machine learning and visual data mining. In this approach, multi-dimensional data visualization techniques are employed to facilitate user interactions with the machine learning and mining process. This allows dynamic user feedback in different forms, such as data selection, data labeling, and data correction, to enhance the efficiency of model building. In particular, this approach can significantly reduce the amount of data required for training an accurate model, and therefore can be highly impactful for applications where large amount of data is hard to obtain. The proposed approach is tested on two application problems: the handwriting recognition (classification) problem and the human cognitive score prediction (regression) problem. Both experiments show that visualization supported interactive machine learning and data mining can achieve the same accuracy as an automatic process can with much smaller training data sets.
  • Shifted Maps: Revealing spatio-temporal topologies in movement data
    • We present a hybrid visualization technique that integrates maps into network visualizations to reveal and analyze diverse topologies in geospatial movement data. With the rise of GPS tracking in various contexts such as smartphones and vehicles there has been a drastic increase in geospatial data being collect for personal reflection and organizational optimization. The generated movement datasets contain both geographical and temporal information, from which rich relational information can be derived. Common map visualizations perform especially well in revealing basic spatial patterns, but pay less attention to more nuanced relational properties. In contrast, network visualizations represent the specific topological structure of a dataset through the visual connections of nodes and their positioning. So far there has been relatively little research on combining these two approaches. Shifted Maps aims to bring maps and network visualizations together as equals. The visualization of places shown as circular map extracts and movements between places shown as edges, can be analyzed in different network arrangements, which reveal spatial and temporal topologies of movement data. We implemented a web-based prototype and report on challenges and opportunities about a novel network layout of places gathered during a qualitative evaluation.
    • Demo!
  • More TkInter.
    • Starting Modern Tkinter for Busy Python Developers
    • Spent a good deal of time working through how to get an image to appear. There are two issues:
      • Loading file formats:
        from tkinter import *
        from tkinter import ttk
        from PIL import Image, ImageTk
      • This is because python doesn’t know natively how to load much beyond gif, it seems. However, there is the Python Image Library, which does. Since the original PIL is deprecated, install Pillow instead. It looks like the import and bindings are the same.
      • dealing with garbage collection (“self” keeps the pointer alive):
        image = Image.open("hal.jpg")
        self.photo = ImageTk.PhotoImage(image)
        ttk.Label(mainframe, image=self.photo).grid(column=1, row=1, sticky=(W, E))
      • The issue is that if the local variable that contains the reference goes out of scope, the garbage collector (in Tkinter? Not sure) scoops it up before the picture can even appear, causing the system (and the debugger) to try to draw a None. If you make the reference global to the class (i.e. self.xxx), then the reference is maintained and everything works.
    • The relevant stack overflow post.
    • A pretty picture of everything working:
      • app
  • The 8.6.9 Tk/Ttk documentation
  • Looks like there are some WYSIWYG tools for building pages. PyGubu looks like its got the most recent activity
  • Now my app resizes on grid layouts: app2

Phil 1.27.19

The first group is through the test dungeon! Sooooooooooooooooooo much good data! Here’s a taste.

“Huffing a small breath out she did her best to figure out if the beings they were seeing matched up to the outlines they’d seen in the mist previously and if anything about the pair seemed off or odd. She does the same for the dragon though less familiar with the beasts than normal humans, it’s deal… seemed like too easy of a solution and it seemed highly unlikely that it was going to just let them run off with part of its hoard – which in her mind meant it was likely some sort of trick. Figuring out what the trick of it all was currently was her main focus.”

Continuing on my into to TkInter, which is looking a lot like FLTK from my C++ GUI days. I am not complaining. FLTK was awesome.

Phil 1.26.19

Tangled Worldview Model of Opinion Dynamics

  • We study the joint evolution of worldviews by proposing a model of opinion dynamics, which is inspired in notions from evolutionary ecology. Agents update their opinion on a specific issue based on their propensity to change — asserted by the social neighbours — weighted by their mutual similarity on other issues. Agents are, therefore, more influenced by neighbours with similar worldviews (set of opinions on various issues), resulting in a complex co-evolution of each opinion. Simulations show that the worldview evolution exhibits events of intermittent polarization when the social network is scale-free. This, in turn, trigger extreme crashes and surges in the popularity of various opinions. Using the proposed model, we highlight the role of network structure, bounded rationality of agents, and the role of key influential agents in causing polarization and intermittent reformation of worldviews on scale-free networks.
  • Saved to Flocking and Herding

Phil 1.25.19

7:00 – 5:30 ASRC NASA/PhD

    • Practical Deep Learning for Coders, v3
    • Continuing Clockwork Muse (reviews on Amazon are… amazingly thorough) , which is a slog but an interesting slog. Martindale is talking about how the pattern of increasing arousal potential and primordial/stylistic content is self-similar across scales of the individual work to populations and careers.
    • Had a bunch of thoughts about primordial content and the ending of the current dungeon.
    • Last day of working on NOAA. I think there is a better way to add/subtract months here in stackoverflow
    • Finish review of CHI paper. Mention Myanmar and that most fake news sharing is done by a tiny fraction of the users, so finding the heuristics of those users is a critical question. Done!
    • Setting up Fake news on Twitter during the 2016 U.S. presidential election as the next paper in the queue. The references look extensive (69!) and good.
    • TFW you don’t want any fancy modulo in your math confusing you:
      def add_month(year: int, month: int, offset: int) -> [int, int]:
          # print ("original date = {}/{}, offset = {}".format(month, year, offset))
          new_month = month + offset
          new_year = year
      
          while new_month < 1:         new_month += 12         new_year -= 1     while new_month > 12:
              new_month -= 12
              new_year += 1
      
          return new_month, new_year
    • Got a version of the prediction system running on QA. Next week I start something new


Phil 1.24.19

7:00 – 4:30 ASRC NASA/PhD

  • Fake news on Twitter during the 2016 U.S. presidential election
    • The spread of fake news on social media became a public concern in the United States after the 2016 presidential election. We examined exposure to and sharing of fake news by registered voters on Twitter and found that engagement with fake news sources was extremely concentrated. Only 1% of individuals accounted for 80% of fake news source exposures, and 0.1% accounted for nearly 80% of fake news sources shared. Individuals most likely to engage with fake news sources were conservative leaning, older, and highly engaged with political news. A cluster of fake news sources shared overlapping audiences on the extreme right, but for people across the political spectrum, most political news exposure still came from mainstream media outlets.
  • One Simple Trick is now live on IEEE!
  • Antibubbles is going well
  • Work on CHI review. Mention this: Less than you think: Prevalence and predictors of fake news dissemination on Facebook
  • Starting to work on the Slack data ingestion and database population. I really want a file dialog to navigate to the Slack folders. StackOverflow suggests tkinter. And lo, it worked just like that:
    import tkinter as tk
    from tkinter import filedialog
    
    root = tk.Tk()
    root.withdraw()
    
    file_path = filedialog.askopenfilename()
  • More beating on the prediction pipeline
    • Load up all the parts of the prediction histories and entries – done
    • Store the raw data in the various prediction tables – done
    • populate PredictedAvailableUDO table – done
    • There’s an error in interpolate that I’m not handling correctly, and I’m too cooked to be able to see it. Tomorrow. interpolatebug

Phil 1.23.19

ASRC NASA 9:00 – 4:30

  • New schema, as of yesterday: diagram
  • Next steps for financial analytics
  • Found a subtle error with creating the actual date from the fiscal date:
    def override_dates(self, year: int, fmonth: int):
        # handle fiscal math converting months that are greater than 12 to the correct fiscal year and month
        self.fiscal_year = year
        if fmonth > 12:
            fmonth = (fmonth % 12) + 1
            self.fiscal_year += 1
        self.fiscal_month = fmonth
    
        # convert the fiscal month and year to actual
        month = fmonth + 2 # convert from US Gov Fiscal to Actual
        self.actual_year = year
        if month > 12:
            month = (month % 12)
            self.actual_year += 1
        self.actual_month = month

    The issue is how the months are handled. The fiscal month is taking an unbounded number and modding it by 12. That produces a range from 0 – 11, so I add one to the result. The actual month is offset by 2 months (The end of the fiscal year is two months before the end of the actual year). So in this case I mod by 12, but don’t have to add the one because it’s working on a range of 1 – 12, not 0 – 11. Anyway, I think it’s fixed now.

Phil 1.22.19

9:00 – 5:00 – ASRC PhD/NASA

  • Google AI proposal is due today! DONE!
  • Next steps for financial analytics
    • Get the historical data to Aaron’s code. Need to look at Pandas’ read_json
    • Get the predictions and intervals back
    • Store the raw data
    • update and insert the lineitems – nope
    • populate PredictedAvailableUDO table
  • Big five personality test (For players and characters) Github

Phil 1.21.19

9:00 – 3:30 ASRC NASA

woodgrain

Starting the day off right

    • Less than you think: Prevalence and predictors of fake news dissemination on Facebook
      • So-called “fake news” has renewed concerns about the prevalence and effects of misinformation in political campaigns. Given the potential for widespread dissemination of this material, we examine the individual-level characteristics associated with sharing false articles during the 2016 U.S. presidential campaign. To do so, we uniquely link an original survey with respondents’ sharing activity as recorded in Facebook profile data. First and foremost, we find that sharing this content was a relatively rare activity. Conservatives were more likely to share articles from fake news domains, which in 2016 were largely pro-Trump in orientation, than liberals or moderates. We also find a strong age effect, which persists after controlling for partisanship and ideology: On average, users over 65 shared nearly seven times as many articles from fake news domains as the youngest age group.
  • Working with Aaron on plumbing up the analytic pieces
  • Getting interpolation to work. Done! Kind of tricky, I had to iterate in reverse over the range so that I didn’t step on my indexes. By the way, this is how Python code looks if you’re not a Python programmer:
def interpolate(self):
    num_entries = len(self.data)
    # we step backwards so that inserts don't mess up our indexing
    for i in reversed(range(0, num_entries - 1)):
        current = self.data[i]
        next = self.data[i + 1]
        next_month = current.fiscal_month + 1
        if next_month > 12:
            next_month = 1
        if next_month != next.fiscal_month: # NOTE: This will not work if there is exactly one year between disbursements
            # we need to make some entries and insert them in the list
            target_month = next.fiscal_month
            if next.fiscal_month < current.fiscal_month:
                target_month += 12
            #print("interpolating between current month {} and target month {} / next fiscal {}".format(current.fiscal_month, target_month, next.fiscal_month))
            for fm in reversed(range(current.fiscal_month+1, target_month)):
                new_entry = PredictionEntry(current.get_creation_query_result())
                new_entry.override_dates(current.fiscal_year, fm)
                self.data.insert(i+1, new_entry)
                #print("\tgenerateing fiscal_month {}".format(fm))
  • So this:
tuple = 70/1042/402 contract expires: 2018-12-30 23:59:59
fiscalmonth = 9, fiscalyear = 2017, value = 85000.0, balance = 85000.0
fiscalmonth = 12, fiscalyear = 2017, value = -11041.23, balance = 73958.77
fiscalmonth = 1, fiscalyear = 2018, value = 0.0, balance = 73958.77
fiscalmonth = 2, fiscalyear = 2018, value = -28839.7, balance = 45119.07
fiscalmonth = 3, fiscalyear = 2018, value = 171490.55, balance = 216609.62
fiscalmonth = 4, fiscalyear = 2018, value = -14539.61, balance = 202070.01
fiscalmonth = 5, fiscalyear = 2018, value = -15608.09, balance = 186461.92
fiscalmonth = 9, fiscalyear = 2018, value = -60967.36, balance = 125494.56
fiscalmonth = 10, fiscalyear = 2018, value = -14211.78, balance = 111282.78
fiscalmonth = 1, fiscalyear = 2019, value = -23942.68, balance = 87340.1
fiscalmonth = 2, fiscalyear = 2019, value = -35380.81, balance = 51959.29
  • Gets expanded to this
tuple = 70/1042/402 contract expires: 2018-12-30 23:59:59
fiscalmonth = 9, fiscalyear = 2017, value = 85000.0, balance = 85000.0
fiscalmonth = 10, fiscalyear = 2017, value = 85000.0, balance = 85000.0
fiscalmonth = 11, fiscalyear = 2017, value = 85000.0, balance = 85000.0
fiscalmonth = 12, fiscalyear = 2017, value = -11041.23, balance = 73958.77
fiscalmonth = 1, fiscalyear = 2018, value = 0.0, balance = 73958.77
fiscalmonth = 2, fiscalyear = 2018, value = -28839.7, balance = 45119.07
fiscalmonth = 3, fiscalyear = 2018, value = 171490.55, balance = 216609.62
fiscalmonth = 4, fiscalyear = 2018, value = -14539.61, balance = 202070.01
fiscalmonth = 5, fiscalyear = 2018, value = -15608.09, balance = 186461.92
fiscalmonth = 6, fiscalyear = 2018, value = -15608.09, balance = 186461.92
fiscalmonth = 7, fiscalyear = 2018, value = -15608.09, balance = 186461.92
fiscalmonth = 8, fiscalyear = 2018, value = -15608.09, balance = 186461.92
fiscalmonth = 9, fiscalyear = 2018, value = -60967.36, balance = 125494.56
fiscalmonth = 10, fiscalyear = 2018, value = -14211.78, balance = 111282.78
fiscalmonth = 11, fiscalyear = 2018, value = -14211.78, balance = 111282.78
fiscalmonth = 12, fiscalyear = 2018, value = -14211.78, balance = 111282.78
fiscalmonth = 1, fiscalyear = 2019, value = -23942.68, balance = 87340.1
fiscalmonth = 2, fiscalyear = 2019, value = -35380.81, balance = 51959.29
  • Next steps
    • Get the historical data to Aaron’s code
    • Get the predictions and intervals back
    • Store the raw data
    • update and insert the lineitems


Phil 1.20.19

I’m thinking that the RPG belief place/space will appear more trustworthy if they associate the spaces with the places (rooms, then discussion) as opposed to building the maps emphasising the problem solving discussion. I think that this will make sense, as everyone will share the room part of the story, while it’s far less likely that everyone will have the same experience in the room. The starting point, shared by all, is the “you are in a room with a troll sleeping next to a chest”. Everything else is a path leading from that starting point.

Created a Google Forms Informed Consent: tinyurl.com/antibubbles-consent

The Einstein summation convention is the ultimate generalization of products such as matrix multiplication to multiple dimensions. It offers a compact and elegant way of specifying almost any product of scalars/vectors/matrices/tensors. Despite its generality, it can reduce the number of errors made by computer scientists and reduce the time they spend reasoning about linear algebra. It does so by being simultaneously clearermore explicitmore self-documentingmore declarative in style and less cognitively burdensome to use

Quantifying echo chamber effects in information spreading over political communication networks

  • Echo chambers in online social networks, in which users prefer to interact only with ideologically-aligned peers, are believed to facilitate misinformation spreading and contribute to radicalize political discourse. In this paper, we gauge the effects of echo chambers in information spreading phenomena over political communication networks. Mining 12 millions of Twitter messages, we reconstruct a network in which users interchange opinions related to the impeachment of former Brazilian President Dilma Rousseff. We define a continuous polarization parameter that allows to quantify the presence of echo chambers, reflected in two communities of similar size with opposite views of the impeachment process. By means of simple spreading models, we show that the capability of users in propagating the content they produce, measured by the associated spreadability, strongly depends on the their polarization. Users expressing pro-impeachment sentiments are capable to transmit information, on average, to a larger audience than users expressing anti-impeachment sentiments. Furthermore, the users’ spreadability is strictly correlated to the diversity, in terms of political polarization, of the audience reached. Our findings demonstrate that political polarization can hinder the diffusion of information over online social media, and shed light upon the mechanisms allowing to break echo chambers.

Can Machines Learn to Detect Fake News? A Survey Focused on Social Media

  • Through a systematic literature review method, in this work we searched classical electronic libraries in order to find the most recent papers related to fake news detection on social medias. Our target is mapping the state of art of fake news detection, defining fake news and finding the most useful machine learning technique for doing so. We concluded that the most used method for automatic fake news detection is not just one classical machine learning technique, but instead a amalgamation of classic techniques coordinated by a neural network. We also identified a need for a domain ontology that would unify the different terminology and definitions of the fake news domain. This lack of consensual information may mislead opinions and conclusions.

Network generation and evolution based on spatial and opinion dynamics components

  • In this paper, a model for a spatial network evolution based on a Metropolis simulation is presented. The model uses an energy function that depends both on the distance between the nodes and the stated preferences. The agents influence their network neighbors opinions using the CODA model. That means each agent has a preference between two options based on its probabilistic assessment of which option is the best one. The algorithm generates realistic networks for opinion problems as well as temporal dynamics for those networks. The transition from a random state to an ordered situation, as temperature decreases, is described. Different types of networks appear based on the relative strength of the spatial and opinion components of the energy.

Phil 1.19.19

Listening to World Affairs Council

In today’s reality, democracy no longer ends with a revolution or military coup, but with a gradual erosion of political norms. As a growing number of countries are chipping away at liberally democratic values, are these institutions safe from elected, authoritarian leaders? Daniel Ziblatt, professor at Harvard University and co-author of How Democracies Die, discusses the future of liberal democracies with World Affairs CEO Jane Wales.

This is connecting with Clockwork Muse. Martindale talks about the oscillation between primordial and stylistic change. Primordial is big jumps on a rugged fitness landscape and stylistic change is hill climbing through refinement. In politics, this may compare to reactionary/populist – big jumps to simpler answers and progressivism which is hill climbing to locally optimal solutions. In both cases, the role of habituation and arousal potential are important. Elites making incremental progress is not exciting. MAGA is exciting, and for both sides.

Phil 1.18.19

7:00 – ASRC PhD/NASA

  • Finalized the Google AIfSG proposal with Don yesterday evening. Here’s hoping it goes in!
  • Worked on the PHP code to show the story. Converting from BBCode is a pain
  • Now that I have sign off on the charts and have data to work with, I’m building the history ingestor that works on a set of tuples and interpolates across gaps in months. Once that code’s working, I’ll output to excel for a sanity check
    • Got the tuples extracted.
    • Do I need to back project to the beginning of the contract? No.
    • Discussion with Heath about how I’m just basing off the analytic_contractdata and producing predictions ONLY as lineitems. I’ll then modify the lineitems per tuple and new predictions.
  • Discussed using my toy NN to calculate hyperparameters for ARIMA

Phil 1.17.19

7:00 – 3:30 ASRC PhD, NASA

  • Lyrn.AI – Deep Learning Explained
  • Re-learning how to code in PHP again, which is easier if you’ve been doing a lot of C++/Java and not so much if you’ve been doing Python. Anyway, I wrote a small class:
    class DbIO2 {
        protected $connection = NULL;
    
        function connect($db_hostname, $db_username, $db_password, $db_database){
            $toReturn = array();
            $this->connection = new mysqli($db_hostname, $db_username, $db_password, $db_database);
            if($this->connection->connect_error){
                $toReturn['connect_successful'] = false;
                $toReturn['connect_error'] = $this->connection->error;
            } else {
                $toReturn['connect_successful'] = true;
            }
            return $toReturn;
        }
    
    
        function runQuery($query) {
            $toReturn = array();
            if($query == null){
                $toReturn['query_error'] = "query is empty";
                return $toReturn;
            }
            $result = $this->connection->query($query);
    
            if (!$result) {
                $toReturn['database_access'] = $this->connection->error;
                return $toReturn;
            }
    
            $numRows = $result->num_rows;
    
            for ($j = 0 ; $j < $numRows ; ++$j)         {             $result->data_seek($j);
                $row = $result->fetch_assoc();
                $toReturn[$j] = $row;
            }
            return $toReturn;
        }
    }
  • And exercised it
    require_once '../../phpFiles/ro_login.php';
    require_once '../libs/io2.php';
    
    $dbio = new DbIO2();
    
    $result = $dbio->connect($db_hostname, $db_username, $db_password, $db_database);
    
    printf ("%s\n",json_encode($result));
    
    $result = $dbio->runQuery("select * from post_view");
    
    foreach ($result as $row)
        printf ("%s\n", json_encode($row));
  • Which gave me some results
    {"connect_successful":true}
    {"post_id":"4","post_time":"2018-11-27 16:00:27","topic_id":"4","topic_title":"SUBJECT: 3 Room Linear Dungeon Test 1","forum_id":"14","forum_name":"DB Test","username":"dungeon_master1","poster_ip":"71.244.249.217","post_subject":"SUBJECT: 3 Room Linear Dungeon Test 1","post_text":"POST: dungeon_master1 says that you are about to take on a 3-room linear dungeon."}
    {"post_id":"5","post_time":"2018-11-27 16:09:12","topic_id":"4","topic_title":"SUBJECT: 3 Room Linear Dungeon Test 1","forum_id":"14","forum_name":"DB Test","username":"dungeon_master1","poster_ip":"71.244.249.217","post_subject":"SUBJECT: dungeon_master1's introduction to room_0","post_text":"POST: dungeon_master1 says, The party now finds itself in room_0. There is a troll here."}
    (repeat for another 200+ lines)
  • So I’m well on my way to being able to show the stories (both from the phpbb and slack) on the Antibubbles “stories” page

4:00 – 5:00 Meeting with Don

Phil 1.16.18

7:00 – 5:00 ASRC NASA

  • Starting to take a deep look at Slack as another Antibubbles RPG dungeon. From yesterday’s post
    • You can download conversations as JSON files, and I’d need to build (or find) a dice bot.
    • Created Antibubbles.slack.com
    • Ok, getting at the data is trivial. An admin can just go to antibubbles.slack.com/services/export. You get a nice zip file that contains everything that you need to reconstruct users and conversations: slack
    • The data is pretty straightforward too. Here’s the JSON file that has my first post in test-dungeon-1:
      {
              "client_msg_id": "41744548-2c8c-4b7e-b01a-f7cba402a14e",
              "type": "message",
              "text": "SUBJECT: dungeon_master1's introduction to the dungeon\n\tPOST: dungeon_master1 says that you are about to take on a 3-room linear dungeon.",
              "user": "UFG26JUS3",
              "ts": "1547641117.000400"
          }

      So we have the dungeon (the directory/file), unique id for message and user, the text and a timestamp. I’m going to do a bit more reading and then look into getting the Chat & Slash App.

    • Looking at the Workspace Admin page. Trying to see where the IRB can be presented.
  • More work on getting the historical data put into a reasonable format. Put together a spreadsheet with the charts for all permutations of fundcode/project/contractfor discussion tomorrow.
  • Updated the AI for social good proposal. Need to get the letter signed by mayself and Aaron tomorrow.
  • Pytorch tutorial, with better variable names than usual