
7:00 – 4:00 PhD
- Dissertation. Here’s how to do a timeline (support.office.com/en-us/article/create-a-timeline). Nope – this is horrible
- Let’s try Python. Woohoo! It’s overkill, but looks great:
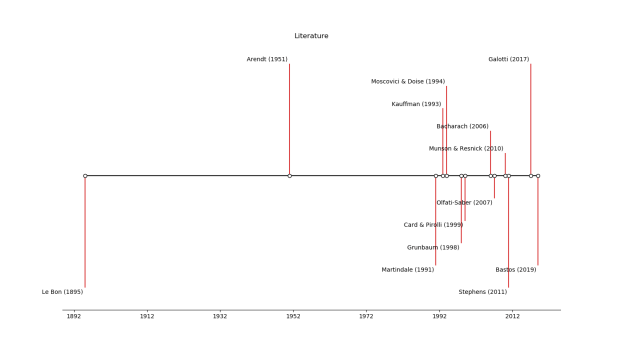
- Here’s the code:
import matplotlib.pyplot as plt import numpy as np from datetime import datetime names = ['Le Bon', 'Arendt', 'Martindale', 'Moscovici & Doise', 'Grunbaum', 'Kauffman', 'Card & Pirolli', 'Bacharach', 'Olfati-Saber', 'Munson & Resnick', 'Stephens', 'Galotti', 'Bastos'] dates = ['1895', '1951', '1991', '1994', '1998', '1993', '1999', '2006', '2007', '2010', '2011', '2017', '2019'] namedates = [] for i in range(len(names)): namedates.append("{} ({})".format(names[i], dates[i])) # Convert date strings (e.g. 2014-10-18) to datetime dates = [datetime.strptime(d, "%Y") for d in dates] # Choose some nice levels levels = np.tile([-5, 5, -4, 4, -3, 3, -2, 2, -1, 1], int(np.ceil(len(dates)/6)))[:len(dates)] # Create figure and plot a stem plot with the date fig, ax = plt.subplots(figsize=(8.8, 4), constrained_layout=True) ax.set(title="Literature") markerline, stemline, baseline = ax.stem(dates, levels, linefmt="C3-", basefmt="k-", use_line_collection=True) plt.setp(markerline, mec="k", mfc="w", zorder=3) # Shift the markers to the baseline by replacing the y-data by zeros. markerline.set_ydata(np.zeros(len(dates))) # annotate lines vert = np.array(['top', 'bottom'])[(levels > 0).astype(int)] for d, l, r, va in zip(dates, levels, namedates, vert): ax.annotate(r, xy=(d, l), xytext=(-3, np.sign(l)*3), textcoords="offset points", va=va, ha="right") # remove y axis and spines ax.get_yaxis().set_visible(False) for spine in ["left", "top", "right"]: ax.spines[spine].set_visible(False) ax.margins(y=0.1) plt.subplots_adjust(left=0.1, right= 0.9) plt.show() - PhD Day


You must be logged in to post a comment.