Monthly Archives: November 2018

Phil 11.30.18

7:00 – 3:00 ASRC NASA

  • Started Second Person, and learned about GURPS
  • Added a section on navigating belief places and spaces to the dissertation
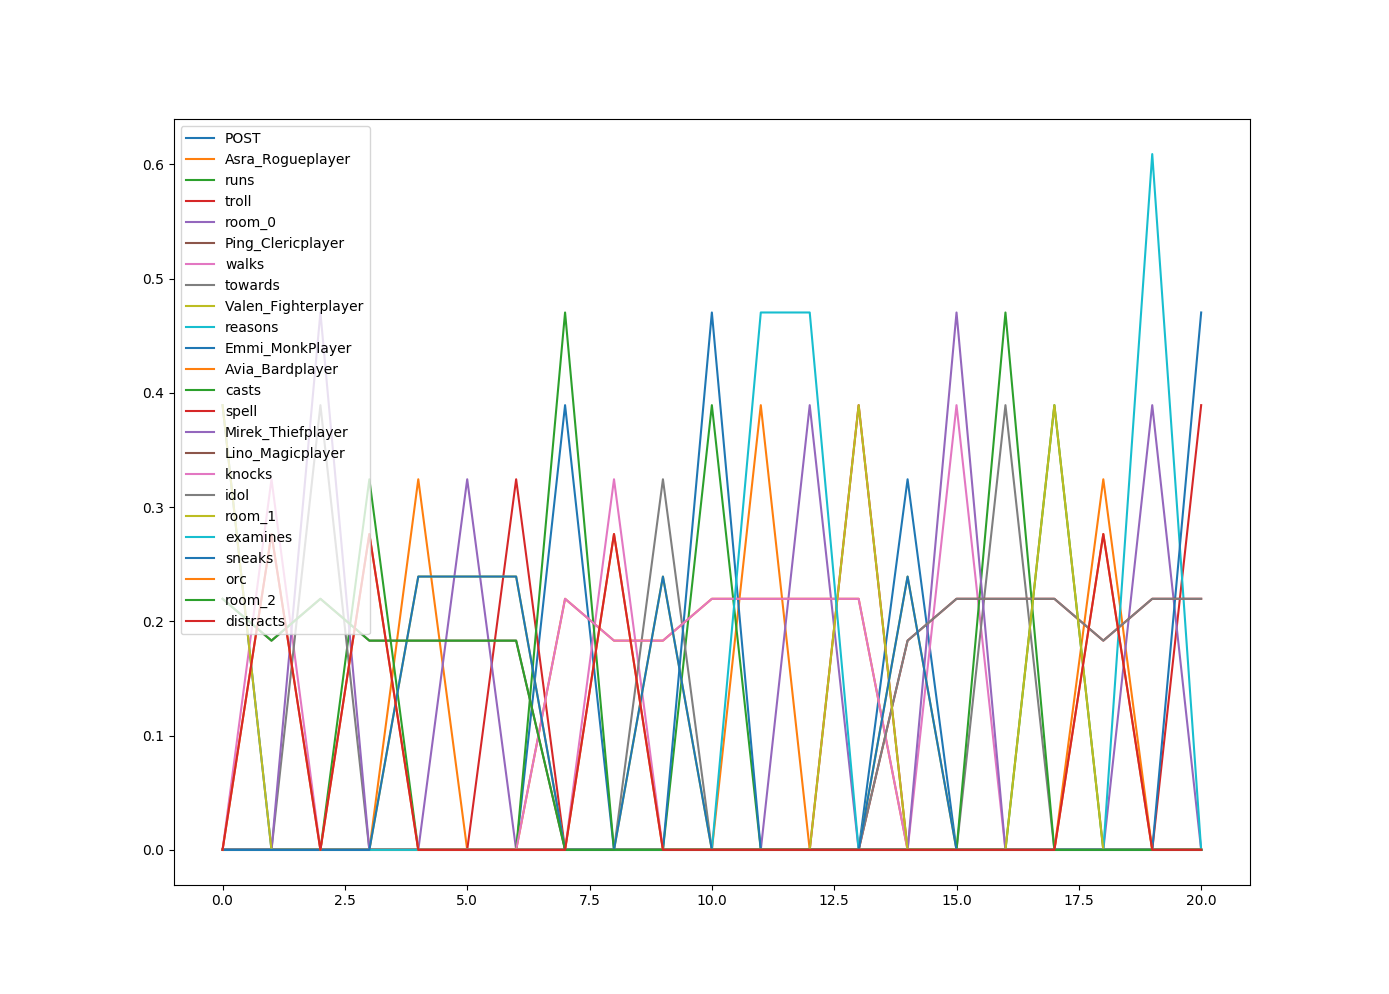
  • It looks like I’m doing Computational Discourse Analysis, which has more to do with how the words in a discussion shift over time. Requested this chapter through ILL
  • Looking at Cornell Conversational Analysis Toolkit
  • More Grokking today so I don’t lose too much focus on understanding NNs
        • Important numpy rules:
          import numpy as np
          
          val = np.array([[0.6]])
          row = np.array([[-0.59, 0.75, -0.94,0.34 ]])
          col = np.array([[-0.59], [ 0.75], [-0.94], [ 0.34]])
          
          print ("np.dot({}, {}) = {}".format(val, row, np.dot(val, row)))
          print ("np.dot({}, {}) = {}".format(col, val, np.dot(col, val)))
          
          '''
          note the very different results:
          np.dot([[0.6]], [[-0.59  0.75 -0.94  0.34]]) = [[-0.354  0.45  -0.564  0.204]]
          np.dot([[-0.59], [ 0.75], [-0.94], [ 0.34]], [[0.6]]) = [[-0.354], [ 0.45 ], [-0.564], [ 0.204]]
          '''
        • So here’s the tricky bit that I don’t get yet
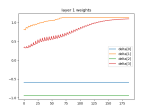
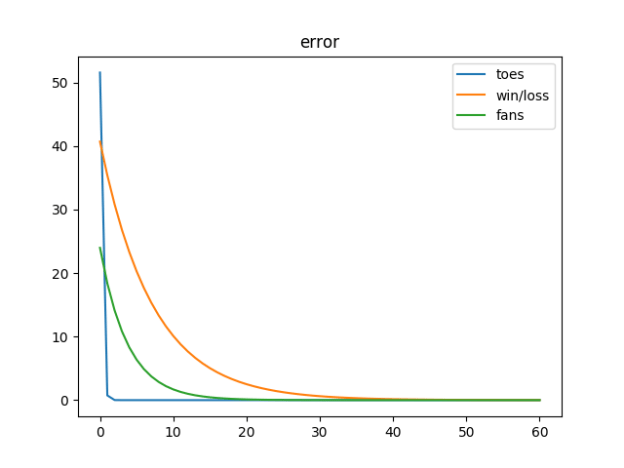
          # Multiply the values of the relu'd layer [[0, 0.517, 0, 0]] by the goal-output_layer [.61]
          weight_mat = np.dot(layer_1_col_array, layer_1_to_output_delta) # e.g. [[0], [0.31], [0], [0]]
          weights_layer_1_to_output_col_array += alpha * weight_mat # add the scaled deltas in
          
          # Multiply the streetlights [[1], [0], [1] times the relu2deriv'd input_to_layer_1_delta [[0, 0.45, 0, 0]]
          weight_mat = np.dot(input_layer_col_array, input_to_layer_1_delta) # e.g. [[0, 0.45, 0, 0], [0, 0, 0, 0], [0, 0.45, 0, 0]]
          weights_input_to_layer_1_array += alpha * weight_mat # add the scaled deltas in
        • It looks to me that as we work back from the output layer, we multiply our layer’s weights by the manipulated (relu in this case) for the last layer, and the derivative in the next layer forward?  I know that we are working out how to distribute the adjustment of the weights via something like the chain rule…


Phil 11.29.18

7:00 – 4:30 ASRC PhD/NASA

    • Listening to repeat of America Abroad Sowing Chaos: Russia’s Disinformation Wars. My original notes are here
    • Finished World without End: The Delta Green Open Campaign Setting, by A. Scott Glancey
      • Overall, this describes the creation of the cannon of the Delta Green playspace. The goal as described was to root the work in existing fiction (Lovecraft’s Cthulhu) and historical fact. This provides the core of the space that players can move out from or fill in. Play does not produce more cannon, so it produces a trajectory that may have high influence for the actual players, but may not move beyond that. The article discusses Agent Angela, as an example of a thumbnail sketch that has become a mythical character, independent of the work of the authors with respect to Cannon. My guess is as the Agent Angela space became “stiffer” that it could also be shared more.
      • As a role-playing game, Delta Green’s narrative differs from the traditional narratives of literature, theater, and film because it offers only plot without characters to drive the story forward. It’s up to the role-players to provide the characters. Role-playing game settings are narratives not built around any specific protagonist, yet capable of accommodating multiple protagonists. Thus, role-playing games, particularly the classic paper-and-dice ones, are by their very nature vast narratives. (page 77)
      • During the designing of the Delta Green vast narrative it was decided that we would publish more open-ended source material than scenarios. Source material is usually built around an enemy of Delta Green with a particular agenda or set of goals, much like a traditional role-playing game scenario is set up, only without the framework of scenes and set pieces designed to channel the players through to a resolution of the scenario. The reason for emphasizing open ended source material over scenarios is that we were trying to encourage Keepers to design their own scenarios without pinning them down with too much canon. That is always a danger with creating a role-playing game background. You want to create a rich environment, but you don’t want to fill in so many details that there is nothing new for the players and Keepers to create with their own games. (Page 81)
      • If the players in a role-playing game campaign start to think that their characters are more disposable than the villain, they are going to feel marginalized After all, whose story is this-theirs or a non-player character’s? The fastest way to alienate a group of players is to give them the impression that they are not the center of the story. If they are not the ones driving the action forward, then what’s the point in playing a role-playing game? They might as well be watching a movie if they cannot affect the pacing, action, and outcome of a story. (Page 83)
    • Going to create a bag of words collection for post subjects and posts that are not from the DM, and then plot the use of the words over time (by sequential post). I think that once stop words are removed, that patterns might be visible.
      • Pulling out the words
      • Have the overall counts
      • Building the count mats
      • Stop words worked, needed to drop punctuation and caps
    • Yoast has an array that looks immediately usable:
      [ "a", "about", "above", "after", "again", "against", "all", "am", "an", "and", "any", "are", "as", "at", "be", "because", "been", "before", "being", "below", "between", "both", "but", "by", "could", "did", "do", "does", "doing", "down", "during", "each", "few", "for", "from", "further", "had", "has", "have", "having", "he", "he'd", "he'll", "he's", "her", "here", "here's", "hers", "herself", "him", "himself", "his", "how", "how's", "i", "i'd", "i'll", "i'm", "i've", "if", "in", "into", "is", "it", "it's", "its", "itself", "let's", "me", "more", "most", "my", "myself", "nor", "of", "on", "once", "only", "or", "other", "ought", "our", "ours", "ourselves", "out", "over", "own", "same", "she", "she'd", "she'll", "she's", "should", "so", "some", "such", "than", "that", "that's", "the", "their", "theirs", "them", "themselves", "then", "there", "there's", "these", "they", "they'd", "they'll", "they're", "they've", "this", "those", "through", "to", "too", "under", "until", "up", "very", "was", "we", "we'd", "we'll", "we're", "we've", "were", "what", "what's", "when", "when's", "where", "where's", "which", "while", "who", "who's", "whom", "why", "why's", "with", "would", "you", "you'd", "you'll", "you're", "you've", "your", "yours", "yourself", "yourselves" ]
    • Good, progress. I’m using TF-IDF to determine the importance of the term in the timeline. That’s ok, but not great. Here’s a plot: room_terms
    • You can see the three rooms, but they don’t stand out all that well. Maybe a low-pass filter on top of this? Anyway, done for the day.


Phil 11.28.18

7:00 – 4:00 ASRC PhD

    • Made so much progress yesterday that I’m not sure what to do next. Going to see if I can run queries against the DB in Python for a start, and then look at the Stanford tools.
      • installed pymysql (in lowercase. There is also a CamelCase version PyMySQL, that seems to be the same thing…)
      • Piece of cake! Here’s the test code:
        import pymysql
        
        class forum_reader:
            connection: pymysql.connections.Connection
        
            def __init__(self, user_name: str, user_password: str, db_name: str):
                print("initializing")
                self.connection = pymysql.connect(host='localhost', user=user_name, password=user_password, db=db_name)
        
            def read_data(self, sql_str: str) -> str:
                with self.connection.cursor() as cursor:
                    cursor.execute(sql_str)
                    result = cursor.fetchall()
                    return"{}".format(result)
        
            def close(self):
                self.connection.close()
        if __name__ == '__main__':
            fr = forum_reader("some_user", "some_pswd", "some_db")
            print(fr.read_data("select topic_id, forum_id, topic_title from phpbb_topics"))
      • And here’s the result:
        initializing
        ((4, 14, 'SUBJECT: 3 Room Linear Dungeon Test 1'),)
      • Note that this is not an object db, which I prefer, but since this is a pre-existing schema, that’s what I’ll be doing. Going to look for a way to turn a query into an object anyway. But it turns out that you can do this:
        self.connection = pymysql.connect(
            host='localhost', user=user_name, password=user_password, db=db_name,
            cursorclass=pymysql.cursors.DictCursor)
      • Which returns as an array of JSON objects:
        [{'topic_id': 4, 'forum_id': 14, 'topic_title': 'SUBJECT: 3 Room Linear Dungeon Test 1'}]
    • Built a MySQL view to get all the data back in one shot:
      CREATE or REPLACE VIEW post_view AS
      SELECT p.post_id, FROM_UNIXTIME(p.post_time) as post_time, p.topic_id, t.topic_title, t.forum_id, f.forum_name, u.username, p.poster_ip, p.post_subject, p.post_text
        FROM phpbb_posts p
        INNER JOIN phpbb.phpbb_forums f ON p.forum_id=f.forum_id
        INNER JOIN phpbb.phpbb_topics t ON p.topic_id=t.topic_id
        INNER JOIN phpbb.phpbb_users u ON p.poster_id=u.user_id;
    • And that works like a charm in the Python code:
      [{
      	'post_id': 4,
      	'post_time': datetime.datetime(2018, 11, 27, 16, 0, 27),
      	'topic_id': 4,
      	'topic_title': 'SUBJECT: 3 Room Linear Dungeon Test 1',
      	'forum_id': 14,
      	'forum_name': 'DB Test',
      	'username': 'dungeon_master1',
      	'poster_ip': '71.244.249.217',
      	'post_subject': 'SUBJECT: 3 Room Linear Dungeon Test 1',
      	'post_text': 'POST: dungeon_master1 says that you are about to take on a 3-room linear dungeon.'
      }]


  • Tricia Wang thick data <- add some discussion about this with respect to gathering RPG data
  • Spend some time Grokking as well. Need to nail down backpropagation. Not today
  • Long discussions with Aaron about the structure of TimeSeriesML. Including looking at FFTs for the initial analytics.
  • A2P/AIMS meeting
    • Terrabytes of AIMS data?

Progress for today 🙂 ide

Phil 11.27.18

7:00 – 5:00 ASRC PhD

  • Statistical physics of liquid brains
    • Liquid neural networks (or ”liquid brains”) are a widespread class of cognitive living networks characterised by a common feature: the agents (ants or immune cells, for example) move in space. Thus, no fixed, long-term agent-agent connections are maintained, in contrast with standard neural systems. How is this class of systems capable of displaying cognitive abilities, from learning to decision-making? In this paper, the collective dynamics, memory and learning properties of liquid brains is explored under the perspective of statistical physics. Using a comparative approach, we review the generic properties of three large classes of systems, namely: standard neural networks (”solid brains”), ant colonies and the immune system. It is shown that, despite their intrinsic physical differences, these systems share key properties with standard neural systems in terms of formal descriptions, but strongly depart in other ways. On one hand, the attractors found in liquid brains are not always based on connection weights but instead on population abundances. However, some liquid systems use fluctuations in ways similar to those found in cortical networks, suggesting a relevant role of criticality as a way of rapidly reacting to external signals.
  • Amazon is releasing a robot cloud dev environment with simulators:
    • AWS RoboMaker’s robotics simulation makes it easy to set up large-scale and parallel simulations with pre-built worlds, such as indoor rooms, retail stores, and racing tracks, so developers can test their applications on-demand and run multiple simulations in parallel. AWS RoboMaker’s fleet management integrates with AWS Greengrass and supports over-the-air (OTA) deployment of robotics applications from the development environment onto the robot. 
  • Working on script generator. Here’s the initial output:
    SUBJECT: dungeon_master1's introduction to the dungeon
    	POST: dungeon_master1 says that you are about to take on a 3-room linear dungeon.
    
    SUBJECT: dungeon_master1's introduction to room_0
    	 POST: dungeon_master1 says, The party now finds itself in room_0. There is a troll here.
    	 SUBJECT: Asra_Rogueplayer's move in room_0
    		 POST: Asra_Rogueplayer runs from the troll in room_0.
    	 SUBJECT: Ping_Clericplayer's move in room_0
    		 POST: Ping_Clericplayer walks towards the troll in room_0.
    	 SUBJECT: Valen_Fighterplayer's move in room_0
    		 POST: Valen_Fighterplayer reasons with the troll in room_0.
    	 SUBJECT: Emmi_MonkPlayer's move in room_0
    		 POST: Emmi_MonkPlayer walks towards the troll in room_0.
    	 SUBJECT: Avia_Bardplayer's move in room_0
    		 POST: Avia_Bardplayer casts a spell at the troll in room_0.
    	 SUBJECT: Mirek_Thiefplayer's move in room_0
    		 POST: Mirek_Thiefplayer casts a spell at the troll in room_0.
    	 SUBJECT: Lino_Magicplayer's move in room_0
    		 POST: Lino_Magicplayer casts a spell at the troll in room_0.
    SUBJECT: dungeon_master1's conclusion for room_0
    	 POST: dungeon_master1 says that you have triumphed in the challenge of room_0.
    
    SUBJECT: dungeon_master1's introduction to room_1
    	 POST: dungeon_master1 says, The party now finds itself in room_1. There is an idol here.
    	 SUBJECT: Asra_Rogueplayer's move in room_1
    		 POST: Asra_Rogueplayer knocks out the idol in room_1.
    	 SUBJECT: Ping_Clericplayer's move in room_1
    		 POST: Ping_Clericplayer walks towards the idol in room_1.
    	 SUBJECT: Valen_Fighterplayer's move in room_1
    		 POST: Valen_Fighterplayer casts a spell at the idol in room_1.
    	 SUBJECT: Emmi_MonkPlayer's move in room_1
    		 POST: Emmi_MonkPlayer examines the idol in room_1.
    	 SUBJECT: Avia_Bardplayer's move in room_1
    		 POST: Avia_Bardplayer sneaks by the idol in room_1.
    	 SUBJECT: Mirek_Thiefplayer's move in room_1
    		 POST: Mirek_Thiefplayer sneaks by the idol in room_1.
    	 SUBJECT: Lino_Magicplayer's move in room_1
    		 POST: Lino_Magicplayer runs from the idol in room_1.
    SUBJECT: dungeon_master1's conclusion for room_1
    	 POST: dungeon_master1 says that you have triumphed in the challenge of room_1.
    
    SUBJECT: dungeon_master1's introduction to room_2
    	 POST: dungeon_master1 says, The party now finds itself in room_2. There is an orc here.
    	 SUBJECT: Asra_Rogueplayer's move in room_2
    		 POST: Asra_Rogueplayer casts a spell at the orc in room_2.
    	 SUBJECT: Ping_Clericplayer's move in room_2
    		 POST: Ping_Clericplayer reasons with the orc in room_2.
    	 SUBJECT: Valen_Fighterplayer's move in room_2
    		 POST: Valen_Fighterplayer knocks out the orc in room_2.
    	 SUBJECT: Emmi_MonkPlayer's move in room_2
    		 POST: Emmi_MonkPlayer runs from the orc in room_2.
    	 SUBJECT: Avia_Bardplayer's move in room_2
    		 POST: Avia_Bardplayer walks towards the orc in room_2.
    	 SUBJECT: Mirek_Thiefplayer's move in room_2
    		 POST: Mirek_Thiefplayer distracts the orc in room_2.
    	 SUBJECT: Lino_Magicplayer's move in room_2
    		 POST: Lino_Magicplayer examines the orc in room_2.
    SUBJECT: dungeon_master1's conclusion for room_2
    	 POST: dungeon_master1 says that you have triumphed in the challenge of room_2.
    
    SUBJECT: dungeon_master1's conclusion
    	POST: dungeon_master1 says that you have triumphed in the challenge of the 3-room linear dungeon.
  • And here are the users. We’ll have to have multiple browsers running anonymous mode to have all these active simultaneously. users
  • Data! data.PNG

Phil 11.26.18

7:00 – 5:00ASRC PhD

  • Had a thought that simulation plus diversity might be an effective way of increasing system resilience. This is based on the discussion of Apollo 13 in Normal Accidents
  • Start folding in content from simulation papers. Don’t worry about coherence yet
  • Start figuring out PHPbb
    • Working on the IRB form – done
    • Set user creation to admin-approved – done
    • Create easily identifiable players
      • Asra Rogueplayer
      • Ping Clericplayer
      • Valen Fighterplayer
      • Emmi MonkPlayer
      • Avia Bardplayer
      • Mirek Thiefplayer
      • Lino Magicplayer
      • Daz Dmplayer
    • Some notes on play by post
    • Added Aaron as a founder. He’s set up the overall structure: dungeon
    • Add easily identifiable content. Working. Set up the AntibubblesDungeon as a python project. I’m going to write a script generator that we will then use to paste in content. Then back up and download the database and run queries on it locally.

Phil 11.24.18

Semantics-Space-Time Cube. A Conceptual Framework for Systematic Analysis of Texts in Space and Time

  • We propose an approach to analyzing data in which texts are associated with spatial and temporal references with the aim to understand how the text semantics vary over space and time. To represent the semantics, we apply probabilistic topic modeling. After extracting a set of topics and representing the texts by vectors of topic weights, we aggregate the data into a data cube with the dimensions corresponding to the set of topics, the set of spatial locations (e.g., regions), and the time divided into suitable intervals according to the scale of the planned analysis. Each cube cell corresponds to a combination (topic, location, time interval) and contains aggregate measures characterizing the subset of the texts concerning this topic and having the spatial and temporal references within these location and interval. Based on this structure, we systematically describe the space of analysis tasks on exploring the interrelationships among the three heterogeneous information facets, semantics, space, and time. We introduce the operations of projecting and slicing the cube, which are used to decompose complex tasks into simpler subtasks. We then present a design of a visual analytics system intended to support these subtasks. To reduce the complexity of the user interface, we apply the principles of structural, visual, and operational uniformity while respecting the specific properties of each facet. The aggregated data are represented in three parallel views corresponding to the three facets and providing different complementary perspectives on the data. The views have similar look-and-feel to the extent allowed by the facet specifics. Uniform interactive operations applicable to any view support establishing links between the facets. The uniformity principle is also applied in supporting the projecting and slicing operations on the data cube. We evaluate the feasibility and utility of the approach by applying it in two analysis scenarios using geolocated social media data for studying people’s reactions to social and natural events of different spatial and temporal scales.

Phil 11.23.18

8:00 – 3:00 ASRC PhD

  • A Map of Knowledge
    • Knowledge representation has gained in relevance as data from the ubiquitous digitization of behaviors amass and academia and industry seek methods to understand and reason about the information they encode. Success in this pursuit has emerged with data from natural language, where skip-grams and other linear connectionist models of distributed representation have surfaced scrutable relational structures which have also served as artifacts of anthropological interest. Natural language is, however, only a fraction of the big data deluge. Here we show that latent semantic structure, comprised of elements from digital records of our interactions, can be informed by behavioral data and that domain knowledge can be extracted from this structure through visualization and a novel mapping of the literal descriptions of elements onto this behaviorally informed representation. We use the course enrollment behaviors of 124,000 students at a public university to learn vector representations of its courses. From these behaviorally informed representations, a notable 88% of course attribute information were recovered (e.g., department and division), as well as 40% of course relationships constructed from prior domain knowledge and evaluated by analogy (e.g., Math 1B is to Math H1B as Physics 7B is to Physics H7B). To aid in interpretation of the learned structure, we create a semantic interpolation, translating course vectors to a bag-of-words of their respective catalog descriptions. We find that the representations learned from enrollments resolved course vectors to a level of semantic fidelity exceeding that of their catalog descriptions, depicting a vector space of high conceptual rationality. We end with a discussion of the possible mechanisms by which this knowledge structure may be informed and its implications for data science.
  • Set up PHP BB and see how accessible the data is.
  • Found an error in the iConf paper standalone/complex/monolithic figure. Fixed for ArXive
  • Set up the dissertation document in LaTex so that I can start putting things in it. Done! In subversion. Used the UMD template here: Thesis & Dissertation Filing, which is the same as the UMBC format listed here: Thesis & Dissertation

Phil 11.22.18

Listening to How CRISPR Gene Editing Is Changing the World, where Jennifer Kahn discusses the concept of Fitness Cost, where mutations (CRISPR or otherwise) often decrease the fitness of the modified organism. I’m thinking that this relates to the conflicting fitness mechanisms of diverse and monolithic systems. Diverse systems are resilient in the long run. Monolithic systems are effective in the short run. That stochastic interaction between those two time scales is what makes the problem of authoritarianism so hard.

Fitness cost is explicitly modeled here: Kinship, reciprocity and synergism in the evolution of social behaviour

  • There are two ways to model the genetic evolution of social behaviour. Population genetic models using personal fitness may be exact and of wide applicability, but they are often complex and assume very different forms for different kinds of social behaviour. The alternative, inclusive fitness models, achieves simplicity and clarity by attributing all fitness effects of a behaviour to an expanded fitness of the actor. For example, Hamilton’s rule states that an altruistic behaviour will be favoured when -c + rb > 0, where c is the fitness cost to the altruist, b is the benefit to Its partner, and r is their relatedness. But inclusive fitness results are often inexact for interactions between kin, and they do not address phenomena such as reciprocity and synergistic effects that may either be confounded with kinship or operate in its absence. Here I develop a model the results of which may be expressed in terms of either personal or inclusive fitness, and which combines the advantages of both; it Is general, exact, simple and empirically useful. Hamilton’s rule is shown to hold for reciprocity as well as kin selection. It fails because of synergistic effects, but this failure can be corrected through the use of coefficients of synergism, which are analogous to the coefficient of relatedness.

The spread of low-credibility content by social bots

  • The massive spread of digital misinformation has been identified as a major threat to democracies. Communication, cognitive, social, and computer scientists are studying the complex causes for the viral diffusion of misinformation, while online platforms are beginning to deploy countermeasures. Little systematic, data-based evidence has been published to guide these efforts. Here we analyze 14 million messages spreading 400 thousand articles on Twitter during ten months in 2016 and 2017. We find evidence that social bots played a disproportionate role in spreading articles from low-credibility sources. Bots amplify such content in the early spreading moments, before an article goes viral. They also target users with many followers through replies and mentions. Humans are vulnerable to this manipulation, resharing content posted by bots. Successful low-credibility sources are heavily supported by social bots. These results suggest that curbing social bots may be an effective strategy for mitigating the spread of online misinformation.

Using Machine Learning to map the field of Collective Intelligence research cluster_enhance-width-1200

  • As part of our new research programme we have used machine learning and literature search to map key trends in collective intelligence research. This helps us build on the existing body of knowledge on collective intelligence, as well as identify some of the gaps in research that can be addressed to advance the field.

Working on 810 meta-reviews today. Done-ish!

Phil 11.21.18

7:00 – 4:00 ASRC PhD/NASA

  • More adversarial herding: Bots increase exposure to negative and inflammatory content in online social systems
    • Social media can deeply influence reality perception, affecting millions of people’s voting behavior. Hence, maneuvering opinion dynamics by disseminating forged content over online ecosystems is an effective pathway for social hacking. We propose a framework for discovering such a potentially dangerous behavior promoted by automatic users, also called “bots,” in online social networks. We provide evidence that social bots target mainly human influencers but generate semantic content depending on the polarized stance of their targets. During the 2017 Catalan referendum, used as a case study, social bots generated and promoted violent content aimed at Independentists, ultimately exacerbating social conflict online. Our results open challenges for detecting and controlling the influence of such content on society.
    • Bot detection appendix
      • It occurs to me that if bots can be detected, then they can be mapped in aggregate on the belief map. This could show what types of beliefs are being artificially enhanced or otherwise influenced
  • Migrating Characterizing Online Public Discussions through Patterns of Participant Interactions to Phlog. Done!
  • Working my way through Grokking. Today’s progress:
    # based on https://github.com/iamtrask/Grokking-Deep-Learning/blob/master/Chapter6%20-%20Intro%20to%20Backpropagation%20-%20Building%20Your%20First%20DEEP%20Neural%20Network.ipynb
    import numpy as np
    import matplotlib.pyplot as plt
    import typing
    # methods --------------------------------------------
    
    
    # sets all negative numbers to zero
    def relu(x: np.array) -> np.array :
        return (x > 0) * x
    
    
    def relu2deriv(output: float) -> float:
        return output > 0 # returns 1 for input > 0
        # return 0 otherwise
    
    
    def nparray_to_list(vals: np.array) -> typing.List[float]:
        data = []
        for x in np.nditer(vals):
            data.append(float(x))
        return data
    
    
    def plot_mat(title: str, var_name: str, fig_num: int, mat: typing.List[float], transpose: bool = False):
        f = plt.figure(fig_num)
        np_mat = np.array(mat)
        if transpose:
            np_mat = np_mat.T
        plt.plot(np_mat)
        names = []
        for i in range(len(np_mat)):
            names.append("{}[{}]".format(var_name, i))
        plt.legend(names)
        plt.title(title)
    
    # variables ------------------------------------------
    np.random.seed(1)
    hidden_size= 4
    alpha = 0.2
    
    weights_input_to_1_array = 2 * np.random.random((3, hidden_size)) - 1
    weights_1_to_output_array = 2 * np.random.random((hidden_size, 1)) - 1
    # the samples. Columns are the things we're sampling
    streetlights_array = np.array( [[ 1, 0, 1 ],
                                    [ 0, 1, 1 ],
                                    [ 0, 0, 1 ],
                                    [ 1, 1, 1 ] ] )
    
    # The data set we want to map to. Each entry in the array matches the corresponding streetlights_array roe
    walk_vs_stop_array = np.array([1, 1, 0, 0]).T # and why are we using the transpose here?
    
    error_plot_mat = [] # for drawing plots
    weights_l1_to_output_plot_mat = [] # for drawing plots
    weights_input_to_l1_plot_mat = [] # for drawing plots
    
    iter = 0
    max_iter = 1000
    epsilon = 0.001
    layer_2_error = 2 * epsilon
    
    while layer_2_error > epsilon:
        layer_2_error = 0
        for row_index in range(len(streetlights_array)):
            # input holds one instance of the data set at a time
            input_layer_array = streetlights_array[row_index:row_index + 1]
            # layer one holds the results of the NONLINEAR transformation of the input layer's values (multiply by weights and relu)
            layer_1_array = relu(np.dot(input_layer_array, weights_input_to_1_array))
            # output layer takes the LINEAR transformation of the values in layer one and sums them (mult)
            output_layer = np.dot(layer_1_array, weights_1_to_output_array)
    
            # the error is the difference of the output layer and the goal squared
            goal = walk_vs_stop_array[row_index:row_index + 1]
            layer_2_error += np.sum((output_layer - goal) ** 2)
    
            # compute the amount to adjust the transformation weights for layer one to output
            layer_1_to_output_delta = (goal - output_layer)
            # compute the amount to adjust the transformation weights for input to layer one
            input_to_layer_1_delta= layer_1_to_output_delta.dot(weights_1_to_output_array.T) * relu2deriv(layer_1_array)
    
            #Still need to figure out why the transpose, but this is where we incrementally adjust the weights
            l1t_array = layer_1_array.T
            ilt_array = input_layer_array.T
            weights_1_to_output_array += alpha * l1t_array.dot(layer_1_to_output_delta)
            weights_input_to_1_array += alpha * ilt_array.dot(input_to_layer_1_delta)
    
            print("[{}] Error: {:.3f}, L0: {}, L1: {}, L2: {}".format(iter, layer_2_error, input_layer_array, layer_1_array, output_layer))
    
            #print("[{}] Error: {}, Weights: {}".format(iter, total_error, weight_array))
            error_plot_mat.append([layer_2_error])
    
            weights_input_to_l1_plot_mat.append(nparray_to_list(weights_input_to_1_array))
            weights_l1_to_output_plot_mat.append(nparray_to_list(weights_1_to_output_array))
    
            iter += 1
            # stop even if we don't converge
            if iter > max_iter:
                break
    
    print("\n--------------evaluation")
    for row_index in range(len(streetlights_array)):
        input_layer_array = streetlights_array[row_index:row_index + 1]
        layer_1_array = relu(np.dot(input_layer_array, weights_input_to_1_array))
        output_layer = np.dot(layer_1_array, weights_1_to_output_array)
    
        print("{} = {:.3f} vs. {}".format(input_layer_array, float(output_layer), walk_vs_stop_array[row_index]))
    
    # plots ----------------------------------------------
    
    f1 = plt.figure(1)
    plt.plot(error_plot_mat)
    plt.title("error")
    plt.legend(["layer_2_error"])
    
    plot_mat("input to layer 1 weights", "weight", 2, weights_input_to_l1_plot_mat)
    plot_mat("layer 1 to output weights", "weight", 3, weights_l1_to_output_plot_mat)


    plt.show()


Phil 11.20.18

7:00 – 3:30 ASRC PhD/NASA

  • Disrupting the Coming Robot Stampedes: Designing Resilient Information Ecologies got accepted to the iConference! Time to start thinking about the slide deck…
    • Workshop: Online nonsense: tools and teaching to combat fake news on the Web
      • How can we raise the quality of what we find on the Web? What software might we build, what education might we try to provide, and what procedures (either manual or mechanical) might be introduced? What are the technical and legal issues that limit our responses? The speakers will suggest responses to problems, and we’ll ask the audience what they would do in specific circumstances. Examples might include anti-vaccination pages, nonstandard cancer treatments, or climate change denial. We will compare with past history, such as the way CB radio became useless as a result of too much obscenity and abuse, or the way the Hearst newspapers created the Spanish-American War. We’ll report out the suggestions and evaluations of the audience.
  • SocialOcean: Visual Analysis and Characterization of Social Media Bubbles
    • Social media allows citizens, corporations, and authorities to create, post, and exchange information. The study of its dynamics will enable analysts to understand user activities and social group characteristics such as connectedness, geospatial distribution, and temporal behavior. In this context, social media bubbles can be defined as social groups that exhibit certain biases in social media. These biases strongly depend on the dimensions selected in the analysis, for example, topic affinity, credibility, sentiment, and geographic distribution. In this paper, we present SocialOcean, a visual analytics system that allows for the investigation of social media bubbles. There exists a large body of research in social sciences which identifies important dimensions of social media bubbles (SMBs). While such dimensions have been studied separately, and also some of them in combination, it is still an open question which dimensions play the most important role in defining SMBs. Since the concept of SMBs is fairly recent, there are many unknowns regarding their characterization. We investigate the thematic and spatiotemporal characteristics of SMBs and present a visual analytics system to address questions such as: What are the most important dimensions that characterize SMBs? and How SMBs embody in the presence of specific events that resonate with them? We illustrate our approach using three different real scenarios related to the single event of Boston Marathon Bombing, and political news about Global Warming. We perform an expert evaluation, analyze the experts’ feedback, and present the lessons learned.
  • More Grokking. We’re at backpropagation, and I’m not seeing it yet. The pix are cool though:
  • Continuing Characterizing Online Public Discussions through Patterns of Participant Interactions.
    • This paper introduces a computational framework to characterize public discussions, relying on a representation that captures a broad set of social patterns which emerge from the interactions between interlocutors, comments and audience reactions. (Page 198:1)
    • we use it to predict the eventual trajectory of individual discussions, anticipating future antisocial actions (such as participants blocking each other) and forecasting a discussion’s growth (Page 198:1)
    • platform maintainers may wish to identify salient properties of a discussion that signal particular outcomes such as sustained participation [9] or future antisocial actions [16], or that reflect particular dynamics such as controversy [24] or deliberation [29]. (Page 198:1)
    • Systems supporting online public discussions have affordances that distinguish them from other forms of online communication. Anybody can start a new discussion in response to a piece of content, or join an existing discussion at any time and at any depth. Beyond textual replies, interactions can also occur via reactions such as likes or votes, engaging a much broader audience beyond the interlocutors actively writing comments. (Page 198:2)
      • This is why JuryRoom would be distinctly different. It’s unique affordances should create unique, hopefully clearer results.
    • This multivalent action space gives rise to salient patterns of interactional structure: they reflect important social attributes of a discussion, and define axes along which discussions vary in interpretable and consequential ways. (Page 198:2)
    • Our approach is to construct a representation of discussion structure that explicitly captures the connections fostered among interlocutors, their comments and their reactions in a public discussion setting. We devise a computational method to extract a diverse range of salient interactional patterns from this representation—including but not limited to the ones explored in previous work—without the need to predefine them. We use this general framework to structure the variation of public discussions, and to address two consequential tasks predicting a discussion’s future trajectory: (a) a new task aiming to determine if a discussion will be followed by antisocial events, such as the participants blocking each other, and (b) an existing task aiming to forecast the growth of a discussion [9]. (Page 198:2)
    • We find that the features our framework derives are more informative in forecasting future events in a discussion than those based on the discussion’s volume, on its reply structure and on the text of its comments (Page 198:2)
    • we find that mainstream print media (e.g., The New York Times, The Guardian, Le Monde, La Repubblica) is separable from cable news channels (e.g., CNN, Fox News) and overtly partisan outlets (e.g., Breitbart, Sean Hannity, Robert Reich)on the sole basis of the structure of the discussions they trigger (Figure 4).(Page 198:2)
    • Figure 4
    • These studies collectively suggest that across the broader online landscape, discussions take on multiple types and occupy a space parameterized by a diversity of axes—an intuition reinforced by the wide range of ways in which people engage with social media platforms such as Facebook [25]. With this in mind, our work considers the complementary objective of exploring and understanding the different types of discussions that arise in an online public space, without predefining the axes of variation. (Page 198:3)
    • Many previous studies have sought to predict a discussion’s eventual volume of comments with features derived from their content and structure, as well as exogenous information [893069, inter alia]. (Page 198:3)
    • Many such studies operate on the reply-tree structure induced by how successive comments reply to earlier ones in a discussion rooted in some initial content. Starting from the reply-tree view, these studies seek to identify and analyze salient features that parameterize discussions on platforms like Reddit and Twitter, including comment popularity [72], temporal novelty [39], root-bias [28], reply-depth [41, 50] and reciprocity [6]. Other work has taken a linear view of discussions as chronologically ordered comment sequences, examining properties such as the arrival sequence of successive commenters [9] or the extent to which commenters quote previous contributions [58]. The representation we introduce extends the reply-tree view of comment-to-comment. (Page 198:3)
    • Our present approach focuses on representing a discussion on the basis of its structural rather than linguistic attributes; as such, we offer a coarser view of the actions taken by discussion participants that more broadly captures the nature of their contributions across contexts which potentially exhibit large linguistic variation.(Page 198:4)
    • This representation extends previous computational approaches that model the relationships between individual comments, and more thoroughly accounts for aspects of the interaction that arise from the specific affordances offered in public discussion venues, such as the ability to react to content without commenting. Next, we develop a method to systematically derive features from this representation, hence producing an encoding of the discussion that reflects the interaction patterns encapsulated within the representation, and that can be used in further analyses.(Page 198:4)
    • In this way, discussions are modelled as collections of comments that are connected by the replies occurring amongst them. Interpretable properties of the discussion can then be systematically derived by quantifying structural properties of the underlying graph: for instance, the indegree of a node signifies the propensity of a comment to draw replies. (Page 198:5)
      • Quick responses that reflect a high degree of correlation would be tight. A long-delayed “like” could be slack?
    • For instance, different interlocutors may exhibit varying levels of engagement or reciprocity. Activity could be skewed towards one particularly talkative participant or balanced across several equally-prolific contributors, as can the volume of responses each participant receives across the many comments they may author.(Page 198: 5)
    • We model this actor-focused view of discussions with a graph-based representation that augments the reply-tree model with an additional superstructure. To aid our following explanation, we depict the representation of an example discussion thread in Figure 1 (Page 198: 6)
    • Fig1Table1
    • Relationships between actors are modeled as the collection of individual responses they exchange. Our representation reflects this by organizing edges into hyperedges: a hyperedge between a hypernode C and a node c ‘ contains all responses an actor directed at a specific comment, while a hyperedge between two hypernodes C and C’ contains the responses that actor C directed at any comment made by C’ over the entire discussion. (Page 198: 6)
      • I think that this  can be represented as a tensor (hyperdimensional or flattened) with each node having a value if there is an intersection. There may be an overall scalar that allows each type of interaction to be adjusted as a whole
    • The mixture of roles within one discussion varies across different discussions in intuitively meaningful ways. For instance, some discussions are skewed by one particularly active participant, while others may be balanced between two similarly-active participants who are perhaps equally invested in the discussion. We quantify these dynamics by taking several summary statistics of each in/outdegree distribution in the hypergraph representation, such as their maximum, mean and entropy, producing aggregate characterizations of these properties over an entire discussion. We list all statistics computed in the appendices (Table 4). (Page 198: 6, 7)
    • Table4
    • To interpret the structure our model offers and address potentially correlated or spurious features, we can perform dimensionality reduction on the feature set our framework yields. In particular, let X be a N×k matrix whose N rows each correspond to a thread represented by k features.We perform a singular value decomposition on X to obtain a d-dimensional representation X ˜ Xˆ = USVT where rows of U are embeddings of threads in the induced latent space and rows of V represent the hypergraph-derived features. (Page 198: 9)
      • This lets us find the hyperplane of the map we want to build
    • Community-level embeddings. We can naturally extend our method to characterize online discussion communities—interchangeably, discussion venues—such as Facebook Pages. To this end, we aggregate representations of the collection of discussions taking place in a community, hence providing a representation of communities in terms of the discussions they foster. This higher level of aggregation lends further interpretability to the hypergraph features we derive. In particular, we define the embedding U¯C of a community C containing threads {t1, t2, . . . tn } as the average of the corresponding thread embeddings Ut1 ,Ut2 , . . .Utn , scaled to unit l2 norm. Two communities C1 and C2 that foster structurally similar discussions then have embeddings U¯C1 and U¯C2 that are close in the latent space.(Page 198: 9)
      • And this may let us place small maps in a larger map. Not sure if the dimensions will line up though
    • The set of threads to a post may be algorithmically re-ordered based on factors like quality [13]. However, subsequent replies within a thread are always listed chronologically.We address elements of such algorithmic ranking effects in our prediction tasks (§5). (Page 198: 10)
    • Taken together, these filtering criteria yield a dataset of 929,041 discussion threads.(Page 198: 10)
    • We now apply our framework to forecast a discussion’s trajectory—can interactional patterns signal future thread growth or predict future antisocial actions? We address this question by using the features our method extracts from the 10-comment prefix to predict two sets of outcomes that occur temporally after this prefix. (Pg 198:10)
      • These are behavioral trajectories, though not belief trajectories. Maps of these behaviors could probably be built, too.
    • For instance, news articles on controversial issues may be especially susceptible to contentious discussions, but this should not translate to barring discussions about controversial topics outright. Additionally, in large-scale social media settings such as Facebook, the content spurring discussions can vary substantially across different sub-communities, motivating the need to seek adaptable indicators that do not hinge on content specific to a particular context. (Page 198: 11)
    • Classification protocol. For each task, we train logistic regression classifiers that use our full set of hypergraph-derived features, grid-searching over hyperparameters with 5-fold cross-validation and enforcing that no Page spans multiple folds.13 We evaluate our models on a (completely fresh) heldout set of thread pairs drawn from the subsequent week of data (Nov. 8-14, 2017), addressing a model’s potential dependence on various evolving interface features that may have been deployed by Facebook during the time spanned by the training data. (Page 198: 11)
      • We use logistic regression classifiers from scikit-learn with l2 loss, standardizing features and grid-searching over C = {0.001, 0.01, 1}. In the bag-of-words models, we tf-idf transform features, set a vocabulary size of 5,000 words and additionally grid-search over the maximum document frequency in {0.25, 0.5, 1}. (Page 198: 11, footnote 13)
    • We test a model using the temporal rate of commenting, which was shown to be a much stronger signal of thread growth than the structural properties considered in prior work [9] (Page 198: 12)
    • Table 3 shows Page-macroaveraged heldout accuracies for our prediction tasks. The feature set we extract from our hypergraph significantly outperforms all of the baselines in each task. This shows that interactional patterns occurring within a thread’s early activity can signal later events, and that our framework can extract socially and structurally-meaningful patterns that are informative beyond coarse counts of activity volume, the reply-tree alone and the order in which commenters contribute, along with a shallow representation of the linguistic content discussed. (Page 198: 12)
      • So triangulation from a variety of data sources produces more accurate results in this context, and probably others. Not a surprising finding, but important to show
    • Table3
    • We find that in almost all cases, our full model significantly outperforms each subcomponent considered, suggesting that different parts of the hypergraph framework add complementary information across these tasks. (Page 198: 13)
    • Having shown that our approach can extract interaction patterns of practical importance from individual threads, we now apply our framework to explore the space of public discussions occurring on Facebook. In particular, we identify salient axes along which discussions vary by qualitatively examining the latent space induced from the embedding procedure described in §3, with d = 7 dimensions. Using our methodology, we recover intuitive types of discussions, which additionally reflect our priors about the venues which foster them. This analysis provides one possible view of the rich landscape of public discussions and shows that our thread representation can structure this diverse space of discussions in meaningful ways. This procedure could serve as a starting point for developing taxonomies of discussions that address the wealth of structural interaction patterns they contain, and could enrich characterizations of communities to systematically account for the types of discussions they foster. (Page 198: 14) 
      • ^^^Show this to Wayne!^^^
    • The emergence of these groupings is especially striking since our framework considers just discussion structure without explicitly encoding for linguistic, topical or demographic data. In fact, the groupings produced often span multiple languages—the cluster of mainstream news sites at the top includes French (Le Monde), Italian (La Repubblica) and German (SPIEGEL ONLINE) outlets; the “sports” region includes French (L’EQUIPE) as well as English outlets. This suggests that different types of content and different discussion venues exhibit distinctive interactional signatures, beyond lexical traits. Indeed, an interesting avenue of future work could further study the relation between these factors and the structural patterns addressed in our approach, or augment our thread representation with additional contextual information. (Page 198: 15)
    • Taken together, we can use the features, threads and Pages which are relatively salient in a dimension to characterize a type of discussion. (Page 198: 15)
    • To underline this finer granularity, for each examined dimension we refer to example discussion threads drawn from a single Page, The New York Times (https://www.facebook.com/nytimes), which are listed in the footnotes. (Page 198: 15)
      • Common starting point. Do they find consensus, or how the dimensions reduce?
    • Focused threads tend to contain a small number of active participants replying to a large proportion of preceding comments; expansionary threads are characterized by many less-active participants concentrating their responses on a single comment, likely the initial one. We see that (somewhat counterintuitively) meme-sharing discussion venues tend to have relatively focused discussions. (Page 198: 15)
      • These are two sides of the same dimension-reduction coin. A focused thread should be using the dimension-reduction tool of open discussion that requires the participants to agree on what they are discussing. As such it refines ideas and would produce more meme-compatible content. Expansive threads are dimension reducing to the initial post. The subsequent responses go in too many directions to become a discussion.
    • Threads at one end (blue) have highly reciprocal dyadic relationships in which both reactions and replies are exchanged. Since reactions on Facebook are largely positive, this suggests an actively supportive dynamic between actors sharing a viewpoint, and tend to occur in lifestyle-themed content aggregation sub-communities as well as in highly partisan sites which may embody a cohesive ideology. In threads at the other end (red), later commenters tend to receive more reactions than the initiator and also contribute more responses. Inspecting representative threads suggests this bottom-heavy structure may signal a correctional dynamic where late arrivals who refute an unpopular initiator are comparatively well-received. (Page 198: 17)
    • This contrast reflects an intuitive dichotomy of one- versus multi-sided discussions; interestingly, the imbalanced one-sided discussions tend to occur in relatively partisan venues, while multi-sided discussions often occur in sports sites (perhaps reflecting the diversity of teams endorsed in these sub-communities). (Page 198: 17)
      • This means that we can identify one-sided behavior and use that then to look at they underlying information. No need to look in diverse areas, they are taking care of themselves. This is ecosystem management 101, where things like algae blooms and invasive species need to be recognized and then managed
    • We now seek to contrast the relative salience of these factors after controlling for community: given a particular discussion venue, is the content or the commenter more responsible for the nature of the ensuing discussions? (Page 198: 17)
    • This suggests that, perhaps somewhat surprisingly, the commenter is a stronger driver of discussion type. (Page 198: 18)
      • I can see that. The initial commenter is kind of a gate-keeper to the discussion. A low-dimension, incendiary comment that is already aligned with one group (“lock her up”), will create one kind of discussion, while a high-dimensional, nuanced post will create another.
    • We provide a preliminary example of how signals derived from discussion structure could be applied to forecast blocking actions, which are potential symptoms of low-quality interactions (Page 198: 18)
    • Important references

Phil 11.19.18

6:00 – 2:30 ASRC PhD, NASA

  • Antonio didn’t make much in the way of modifications, so I think the paper is now done. Ask tomorrow if it’s alright to put this version on ArXive.
  • ‘Nothing on this page is real’: How lies become truth in online America
    • A new message popped onto Blair’s screen from a friend who helped with his website. “What viral insanity should we spread this morning?” the friend asked. “The more extreme we become, the more people believe it,” Blair replied.
    • “No matter how racist, how bigoted, how offensive, how obviously fake we get, people keep coming back,” Blair once wrote, on his own personal Facebook page. “Where is the edge? Is there ever a point where people realize they’re being fed garbage and decide to return to reality?”
  • Blind appears to be the LinkedIn version of Secret/Whisper
    • Blind is an anonymous social networking platform for professionals. Work email-verified professionals can connect with coworkers and other company/industry professionals by holding meaningful conversations on a variety of different topics.
  • Started reading Third Person. It really does look like the literature is thin:
    • A crucial consideration when editing our previous volume, Second Person, was to give close attention to the underexamined area of tabletop role-playing games. Generally speaking, what scholarly consideration these games have received has cast them as of historical interest, as forerunners of today’s digital games. In his chapter here, Ken Rolston-the designer of major computer role-playing games such as the Elder Scrolls titles Morrowind and Oblivion-says that his strongest genre influences are tabletop RPGs and live-action role-playing (IARP) games. He considers nonwired RPGs to be a continuing vital force, and so do we. (Page 7)
  • Quick meeting with Wayne
    • CHI Play 2019
      • CHI PLAY is the international and interdisciplinary conference (by ACM SIGCHI) for researchers and professionals across all areas of play, games and human-computer interaction (HCI). We call this area “player-computer interaction.”  22–25 October 2019
    • Conversation Map: An Interface for Very-Large-Scale Conversations
      • Very large-scale conversation (VLSC) involves the exchange of thousands of electronic mail (e-mail) messages among hundreds or thousands of people. Usenet newsgroups are good examples (but not the only examples) of online sites where VLSCs take place. To facilitate understanding of the social and semantic structure of VLSCs, two tools from the social sciences—social networks and semantic networks—have been extended for the purposes of interface design. As interface devices, social and semantic networks need to be flexible, layered representations that are useful as a means for summarizing, exploring, and cross-indexing the large volumes of messages that constitute the archives of VLSCs. This paper discusses the design criteria necessary for transforming these social scientific representations into interface devices. The discussion is illustrated with the description of the Conversation Map system, an implemented system for browsing and navigating VLSCs.
    • Terra Nova blog
    • Nic Ducheneaut
      • My research pioneered the use of large-scale, server-side data for modeling behavior in video games. At Xerox PARC I founded the PlayOn project, which conducted the longest and largest quantitative study of user behavior in World of Warcraft (500,000+ players observed over 5 years). At Ubisoft, I translated my findings into practical recommendations for both video game designers and business leaders. Today, as the co-founder and technical lead of Quantic Foundry, I help game companies bridge analytics and game design to maximize player engagement and retention.
    • Nick Yee
      • I’m the co-founder and analytics lead of Quantic Foundry, a consulting practice around game analytics. I combine social science, data science, and an understanding of the psychology of gamers to generate actionable insights in gameplay and game design.
    • Celia pierce
      • Celia Pearce is a game designer, artist, author, curator, teacher, and researcher specializing in multiplayer gaming and virtual worlds, independent, art, and alternative game genres, as well as games and gender. 
    • T. L. Taylor
      • T.L. Taylor is is a qualitative sociologist who has focused on internet and game studies for over two decades. Her research explores the interrelations between culture and technology in online leisure environments. 
    • MIT10: A Reprise – Democracy and Digital Media
      • Paper proposals might address the following topics/issues:
        • politics of truth/lies, alternative facts
        • media, authoritarianism, and polarization
        • diversity in gaming / livestreaming / esports
        • making or breaking publics with algorithmic cultures/machine learning/AI
        • environmental media (from medium theory to climate change) and activism
        • media infrastructures as public utilities or utility publics?
        • social media, creating consensus, and bursting filter bubbles
        • designing media technologies for inclusion
        • the #metoo movement and its impact
        • social media platforms (FaceBook, Twitter, Instagram, etc), politics, and civic responsibility
        • Twitter, viral videos, and the new realities of political advertising
      • Please submit individual paper proposals, which should include a title, author(s) name, affiliation, 250-word abstract, and 75-word biographical statement to this email address: media-in-transition@mit.edu — by February 1, 2019. Early submissions are encouraged and we will review them on a rolling basis. Full panel proposals of 3 to 4 speakers can also be submitted, and should include a panel title and the details listed above for each paper, as well as a panel moderator. We notify you of the status of your proposals by February 15, 2019 at the latest.
  • Continuing Characterizing Online Public Discussions through Patterns of Participant Interactions. Sheesh, that’s a long article. 21 pages!
  • More Grokking: Here’s a very simple full NN:
    # based on https://github.com/iamtrask/Grokking-Deep-Learning/blob/master/Chapter6%20-%20Intro%20to%20Backpropagation%20-%20Building%20Your%20First%20DEEP%20Neural%20Network.ipynb
    import numpy as np
    import matplotlib.pyplot as plt
    
    # variables ------------------------------------------
    
    # one weight for each column (or light - the things we're sampling)
    weight_array = np.random.rand(3)
    alpha = 0.1
    
    # the samples. Columns are the things we're sampling
    streetlights_array = np.array([[1, 0, 1],
                                   [ 0, 1, 1 ],
                                   [ 0, 0, 1 ],
                                   [ 1, 1, 1 ],
                                   [ 0, 1, 1 ],
                                   [ 1, 0, 1 ]])
    
    # The data set we want to map to. Each entry in the array matches the corresponding streetlights_array roe
    walk_vs_stop_array = np.array([0, 1, 0, 1, 1, 0])
    
    error_plot_mat = [] # for drawing plots
    weight_plot_mat = [] # for drawing plots
    iter = 0
    max_iter = 1000
    epsilon = 0.001
    total_error = 2 * epsilon
    
    while total_error > epsilon:
        total_error = 0
        for row_index in range(len(walk_vs_stop_array)):
            input_array = streetlights_array[row_index]
            goal_prediction = walk_vs_stop_array[row_index]
    
            prediction = input_array.dot(weight_array)
            error = (goal_prediction - prediction) ** 2
            total_error += error
    
            delta = prediction - goal_prediction
            weight_array = weight_array - (alpha * (input_array * delta))
    
            print("[{}] Error: {}, Weights: {}".format(iter, total_error, weight_array))
            error_plot_mat.append([total_error, error])
            weight_plot_mat.append(weight_array.copy())
    
            iter += 1
            if iter > max_iter:
                break
    
    
    f1 = plt.figure(1)
    plt.plot(error_plot_mat)
    plt.title("error")
    plt.legend(["total_error", "error"])
    #f1.show()
    
    f2 = plt.figure(2)
    plt.plot(weight_plot_mat)
    names = []
    for i in range(len(weight_array)):
        names.append("weight[{}]".format(i))
    plt.legend(names)
    plt.title("weights")
    
    #f2.show()
    plt.show()
  • And here is it learning

Phil 11.18.18

A neural network will write your D&D character bio

  • Thanks to the wonderful readers of this blog, I’ve been able to apply machine learning to Dungeons and Dragons data of all sorts. I trained a neural network to generate new D&D spells, first on a small datasetthen on a larger one that readers had sent me (dataset here). Another reader sent me a list of D&D creatures, and I trained a neural network on that. Then readers helped me crowdsource a dataset of over 20,908 character names, and I trained a neural network on that as well (dataset here).

Phil 11.16.18

7:00 – 4:00 PhD/NASA ASRC

Phil 11.15.18

ASRC PhD, NASA 7:00 – 5:00

  • Incorporate T’s changes – done!
  • Topic Modeling with LSA, PLSA, LDA & lda2Vec
    • This article is a comprehensive overview of Topic Modeling and its associated techniques.
  • More Grokking. Here’s the work for the day:
    # based on https://github.com/iamtrask/Grokking-Deep-Learning/blob/master/Chapter5%20-%20Generalizing%20Gradient%20Descent%20-%20Learning%20Multiple%20Weights%20at%20a%20Time.ipynb
    import numpy as np
    import matplotlib.pyplot as plt
    import random
    
    # methods ----------------------------------------------------------------
    def neural_network(input, weights):
        out = input @ weights
        return out
    
    def error_gt_epsilon(epsilon: float, error_array: np.array) -> bool:
        for i in range(len(error_array)):
            if error_array[i] > epsilon:
                return True
        return False
    
    # setup vars --------------------------------------------------------------
    #inputs
    toes_array =  np.array([8.5, 9.5, 9.9, 9.0])
    wlrec_array = np.array([0.65, 0.8, 0.8, 0.9])
    nfans_array = np.array([1.2, 1.3, 0.5, 1.0])
    
    #output goals
    hurt_array  = np.array([0.2, 0.0, 0.0, 0.1])
    wl_binary_array   = np.array([  1,   1,   0,   1])
    sad_array   = np.array([0.3, 0.0, 0.1, 0.2])
    
    weights_array = np.random.rand(3, 3) # initialise with random weights
    '''
    #initialized with fixed weights to compare with the book
    weights_array = np.array([ [0.1, 0.1, -0.3], #hurt?
                             [0.1, 0.2,  0.0], #win?
                             [0.0, 1.3,  0.1] ]) #sad?
    '''
    alpha = 0.01 # convergence scalar
    
    # just use the first element from each array fro training (for now?)
    input_array = np.array([toes_array[0], wlrec_array[0], nfans_array[0]])
    goal_array = np.array([hurt_array[0], wl_binary_array[0], sad_array[0]])
    
    line_mat = [] # for drawing plots
    epsilon = 0.01 # how close do we have to be before stopping
    #create and fill an error array that is big enough to enter the loop
    error_array = np.empty(len(input_array))
    error_array.fill(epsilon * 2)
    
    # loop counters
    iter = 0
    max_iter = 100
    
    while error_gt_epsilon(epsilon, error_array): # if any error in the array is big, keep going
    
        #right now, the dot product of the (3x1) input vector and the (3x3) weight vector that returns a (3x1) vector
        pred_array = neural_network(input_array, weights_array)
    
        # how far away are we linearly (3x1)
        delta_array = pred_array - goal_array
        # error is distance squared to keep positive and weight the system to fixing bigger errors (3x1)
        error_array = delta_array ** 2
    
        # Compute how far and in what direction (3x1)
        weights_d_array = delta_array * input_array
    
        print("\niteration [{}]\nGoal = {}\nPred = {}\nError = {}\nDelta = {}\nWeight Deltas = {}\nWeights: \n{}".format(iter, goal_array, pred_array, error_array, delta_array, weights_d_array, weights_array))
    
        #subtract the scaled (3x1) weight delta array from the weights array
        weights_array -= (alpha * weights_d_array)
    
        #build the data for the plot
        line_mat.append(np.copy(error_array))
        iter += 1
        if iter > max_iter:
            break
    
    plt.plot(line_mat)
    plt.title("error")
    plt.legend(("toes", "win/loss", "fans"))
    plt.show()
  • Here’s a chart! Learning
  • Continuing Characterizing Online Public Discussions through Patterns of Participant Interactions

Phil 11.14.18

7:00 – 4:00 ASRC PhD, NASA

  • Discovered Critical Roll D&D Youtube channel
  • Talk to Aaron about adding a time (or post?) constraint to dungeon runs. Faster runs/fewer posts get higher scores. This might be a way to highlight the difference between homogeneous and heterogeneous party composition lexical variance.
  • Added the conversation analytic link to the Belief Spaces doc
  • Added the following bit to my main blog post on Lists, Stories and Maps
  • Add to the Stories, Lists and Maps writeup something about the cognitive power of stories. There is, in many religions and philosophies, the concept of “being in the moment” where we become simply aware of what’s going on right now, without all the cognitive framing and context that we normally bring to every experience [citation needed]. This is different from “mindfulness”, where we try to be aware of the cognitive framing and context. To me, this is indicative of how we experience life through the lens of path dependency, which is a sort of a narrative. If this is true, then it explains the power of stories, because it allows us to literally step into another life. This explains phrases like “losing yourself in a story”.
  • This doesn’t happen with lists. It only happens in special cases in diagrams and maps, where you can see yourself in the map. Which is why the phrase “the map is not the territory” is different from “losing yourself in the story”. In the first case, you confuse your virtual and actual environment. In the latter, you confuse your virtual and actual identity. And since that story becomes part of your path through life, the virtual is incorporated into the actual life narrative, particularly if the story is vivid.
  • So narratives are an alignment mechanism. Simple stories that collapse information into a already existing beliefs can be confirming and reinforcing across a broad population. Complicated stories that challenge existing beliefs require a change in alignment to incorporate. That’s computationally expensive, and will affect fewer people, all things being equal.
  • Which leads me to thinking that the need for novelty is what creates the heading and velocity driven behavior we see in belief space behavior. I think this needs to be a chapter in the dissertation. Just looking for some background literature, I found these:
    • Novelty-Seeking in Rats-Biobehavioral Characteristics and Possible Relationship with the Sensation-Seeking Trait in Man
      • A behavioral trait in rats which resembles some of the features of high-sensation seekers in man has been characterized. Given that the response to novelty is the basis of the definition of sensation-seeking, individual differences in reactivity to novelty have been studied on behavioral and biological levels. Certain individuals labeled as high responders (HR) as opposed to low responders (LR) have been shown to be highly reactive when exposed to a novel environment. These groups were investigated for free-choice responses to novel environments differing in complexity and aversiveness, and to other kinds of reinforcement, i.e. food and a drug. The HR rats appeared to seek novelty, variety and emotional stimulation. Only HR individuals have been found to be predisposed to drug-taking: they develop amphetamine self-administration whereas LR individuals do not. They also exhibit a higher sensitivity to the reinforcing properties of food. On a biological level, compared to LR rats, HR animals have an enhanced level of dopaminergic activity in the nucleus accumbens both under basal conditions or following a tail-pinch stress. HR and LR rats differ in reactivity of the corticotropic axis: HR rats exposed to a novel environment have a prolonged secretion of corticosterone compared to LR rats. The association of novelty, drug and food seeking in the same individual suggests that these characteristics share common processes. Differences in dopaminergic activity between HR and LR rats are consistent with results implicating these dopaminergic neurons in response to novelty and in drug-taking behavior. Given that rats self-administer corticosterone and that HR rats are more sensitive to the reinforcing properties of corticoste-roids, it could be speculated that HR rats seek novelty for the reinforcing action of corticosterone. These characteristics may be analogous to some for the features found in human high-sensation seekers and this animal model may be useful in determinating the biological basis of this human trait.
    • The Psychology and Neuroscience of Curiosity
      • Curiosity is a basic element of our cognition, but its biological function, mechanisms, and neural underpinning remain poorly understood. It is nonetheless a motivator for learning, influential in decision-making, and crucial for healthy development. One factor limiting our understanding of it is the lack of a widely agreed upon delineation of what is and is not curiosity. Another factor is the dearth of standardized laboratory tasks that manipulate curiosity in the lab. Despite these barriers, recent years have seen a major growth of interest in both the neuroscience and psychology of curiosity. In this Perspective, we advocate for the importance of the field, provide a selective overview of its current state, and describe tasks that are used to study curiosity and information-seeking. We propose that, rather than worry about defining curiosity, it is more helpful to consider the motivations for information-seeking behavior and to study it in its ethological context.
    • Theory of Choice in Bandit, Information Sampling and Foraging Tasks
      • Decision making has been studied with a wide array of tasks. Here we examine the theoretical structure of bandit, information sampling and foraging tasks. These tasks move beyond tasks where the choice in the current trial does not affect future expected rewards. We have modeled these tasks using Markov decision processes (MDPs). MDPs provide a general framework for modeling tasks in which decisions affect the information on which future choices will be made. Under the assumption that agents are maximizing expected rewards, MDPs provide normative solutions. We find that all three classes of tasks pose choices among actions which trade-off immediate and future expected rewards. The tasks drive these trade-offs in unique ways, however. For bandit and information sampling tasks, increasing uncertainty or the time horizon shifts value to actions that pay-off in the future. Correspondingly, decreasing uncertainty increases the relative value of actions that pay-off immediately. For foraging tasks the time-horizon plays the dominant role, as choices do not affect future uncertainty in these tasks.
  • How Political Campaigns Weaponize Social Media Bots (IEEE)
    • TrumpClintonBotnets
  • Starting Characterizing Online Public Discussions through Patterns of Participant Interactions
  • More Grokking ML