Monthly Archives: June 2020

Phil 6.30.20

(Re)Discovering Protein Structure and Function Through Language Modeling (ArXiv)(Code)

  • In our study, we show how a language model, trained simply to predict a masked (hidden) amino acid in a protein sequence, recovers high-level structural and functional properties of proteins. In particular, we show how the Transformer language model uses attention (1) to capture the folding structure of proteins, connecting regions that are apart in the underlying sequence but spatially close in the protein structure, and (2) targets binding sites, a key functional component of proteins. We also introduce a three-dimensional visualization of the interaction between attention and protein structure. Our findings align with biological processes and provide a tool to aid scientific discovery. The code for the visualization tool and experiments is available at https://github.com/salesforce/provis.
  • TL;DR: Trained solely on language modeling, the Transformer’s attention mechanism recovers high-level structural and functional properties of proteins.
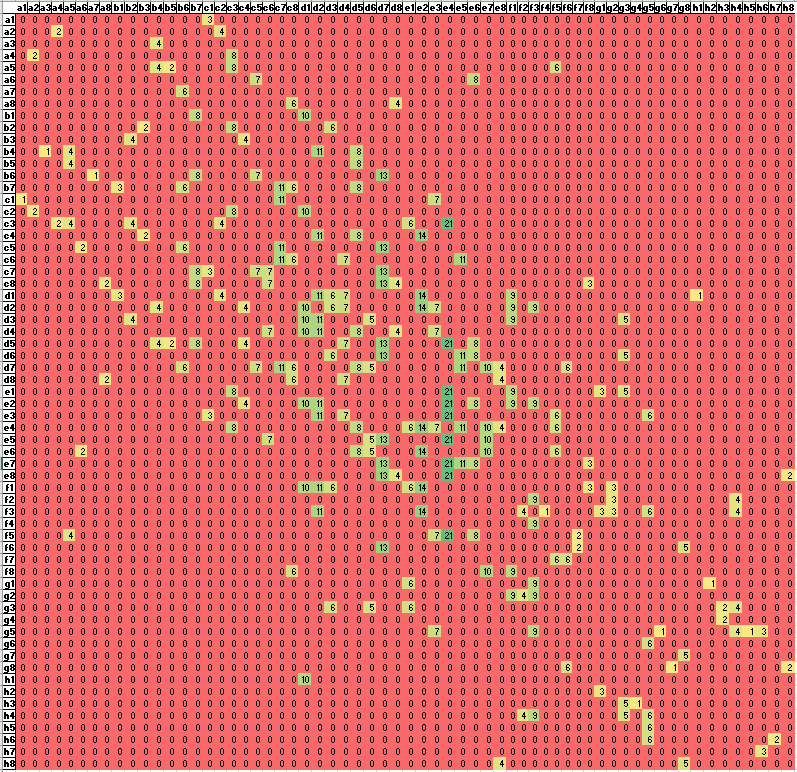
  • We explored the degree to which attention captures these contact relationships by analyzing the attention patterns of 5,000 protein sequences and comparing them to ground-truth contact maps. Our analysis revealed that one particular head — the 12th layer’s 4th head, denoted as head 12-4 — aligned remarkably well with the contact map. For “high confidence” attention (> .9 ), 76% of this head’s total attention connected amino acids that were in contact. In contrast, the background frequency of contacts among all amino acid pairs in the dataset is just 1.3%.
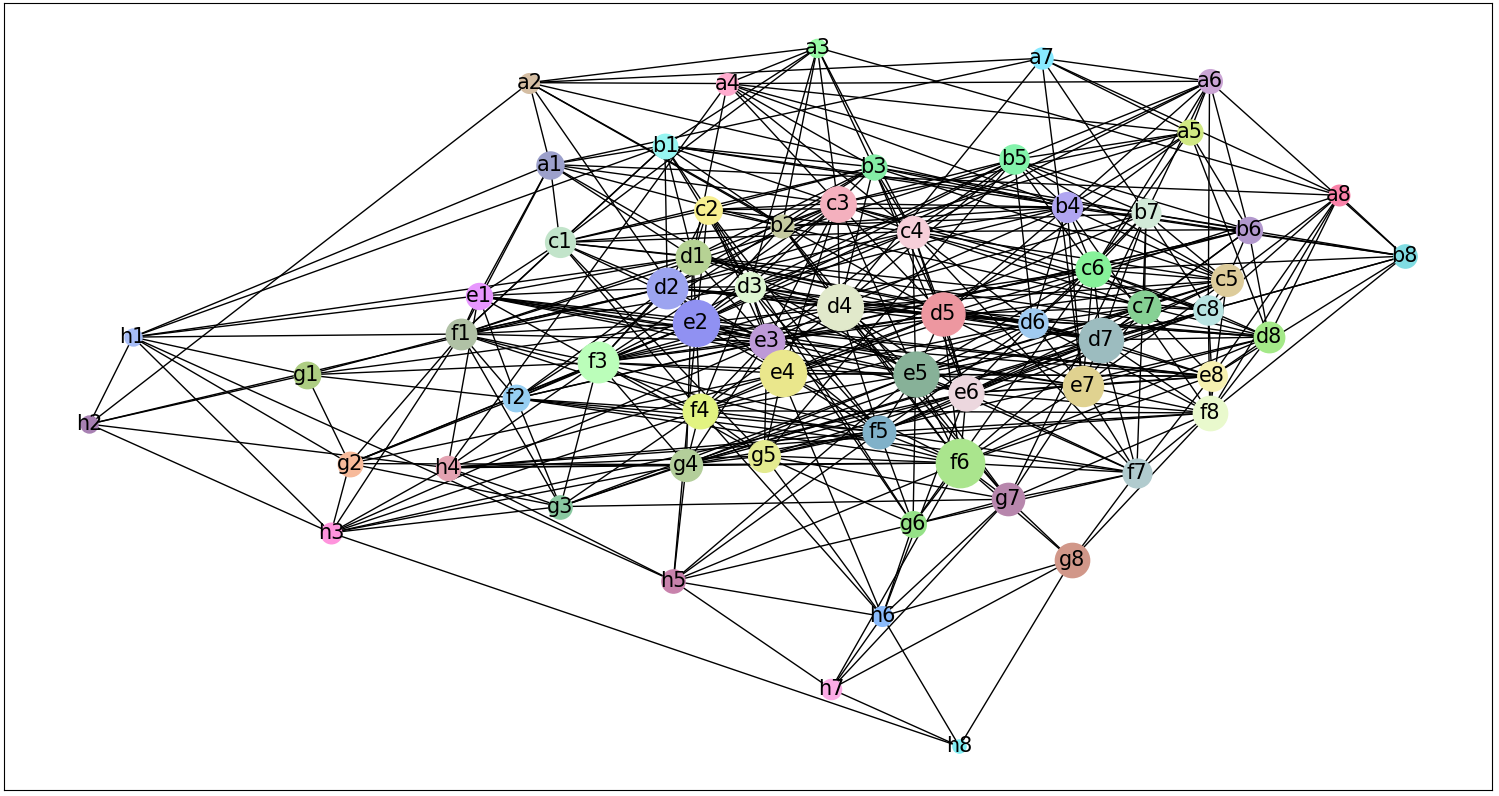
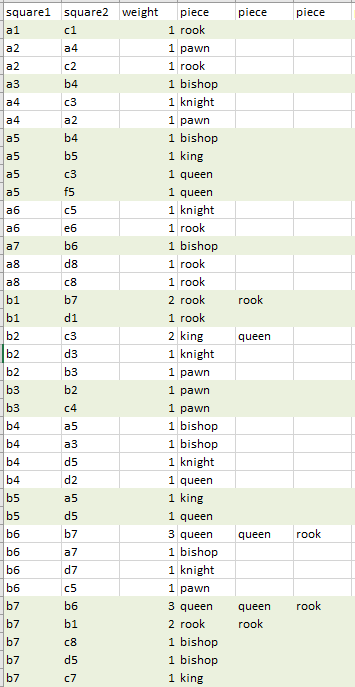
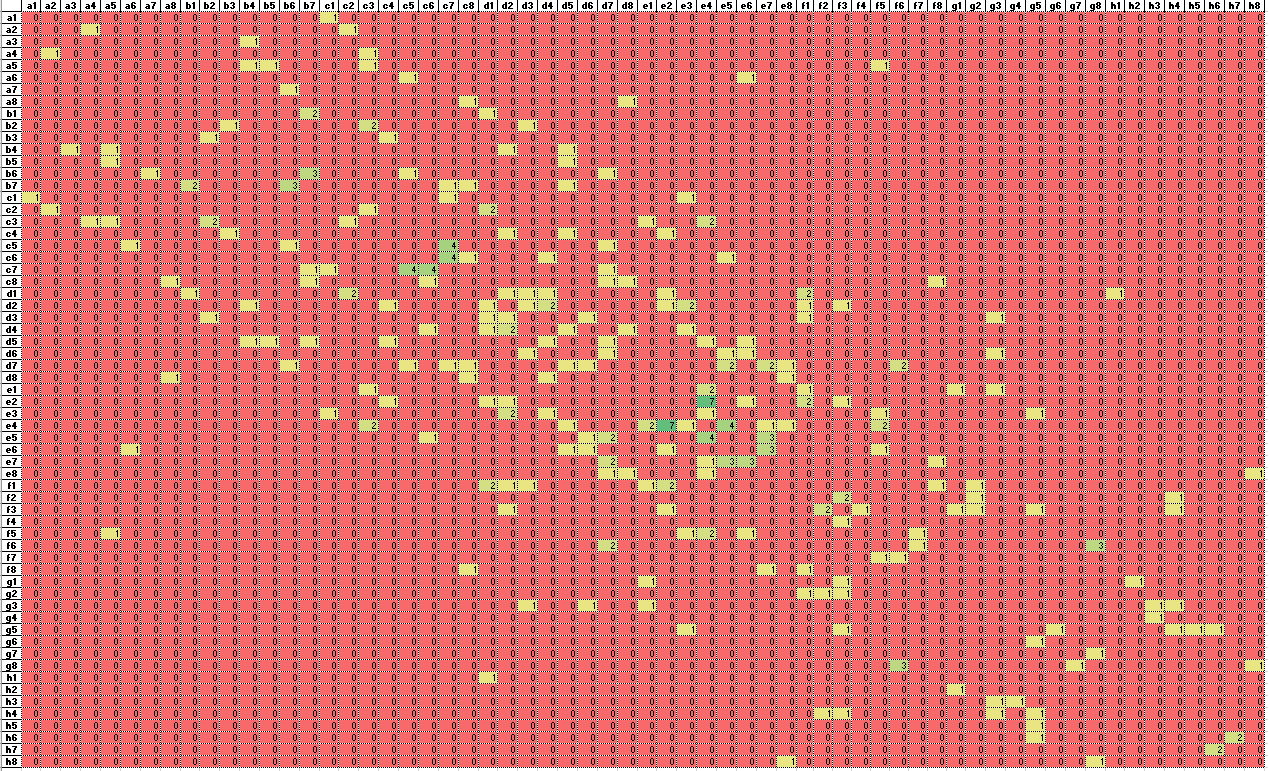
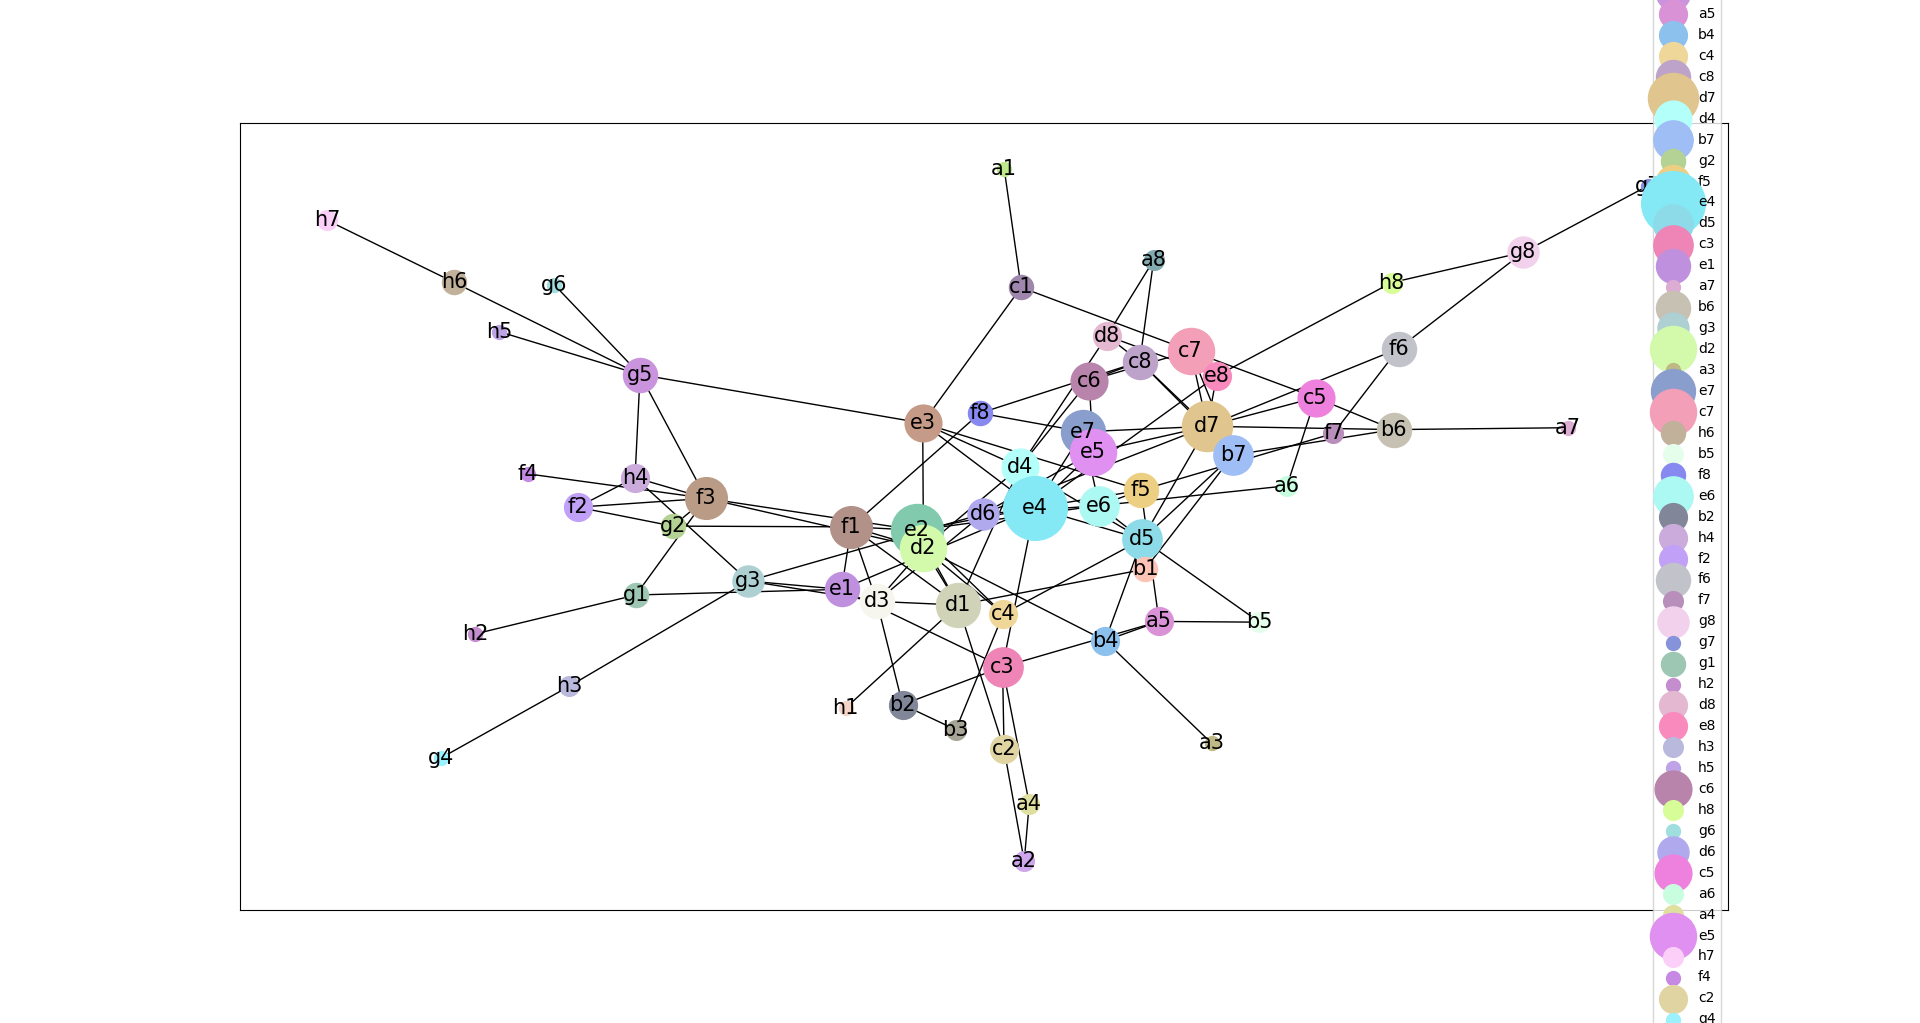
GPT-2 Agents

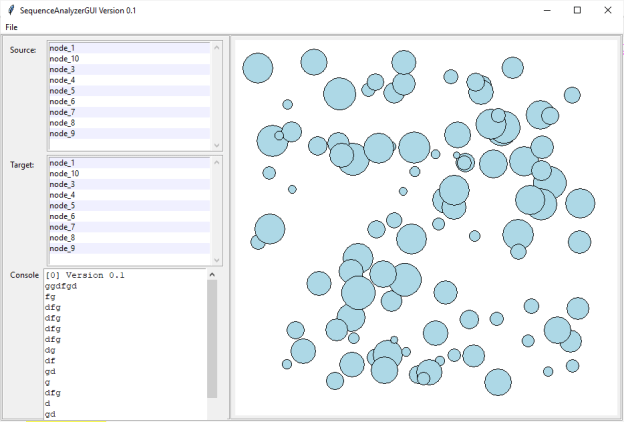
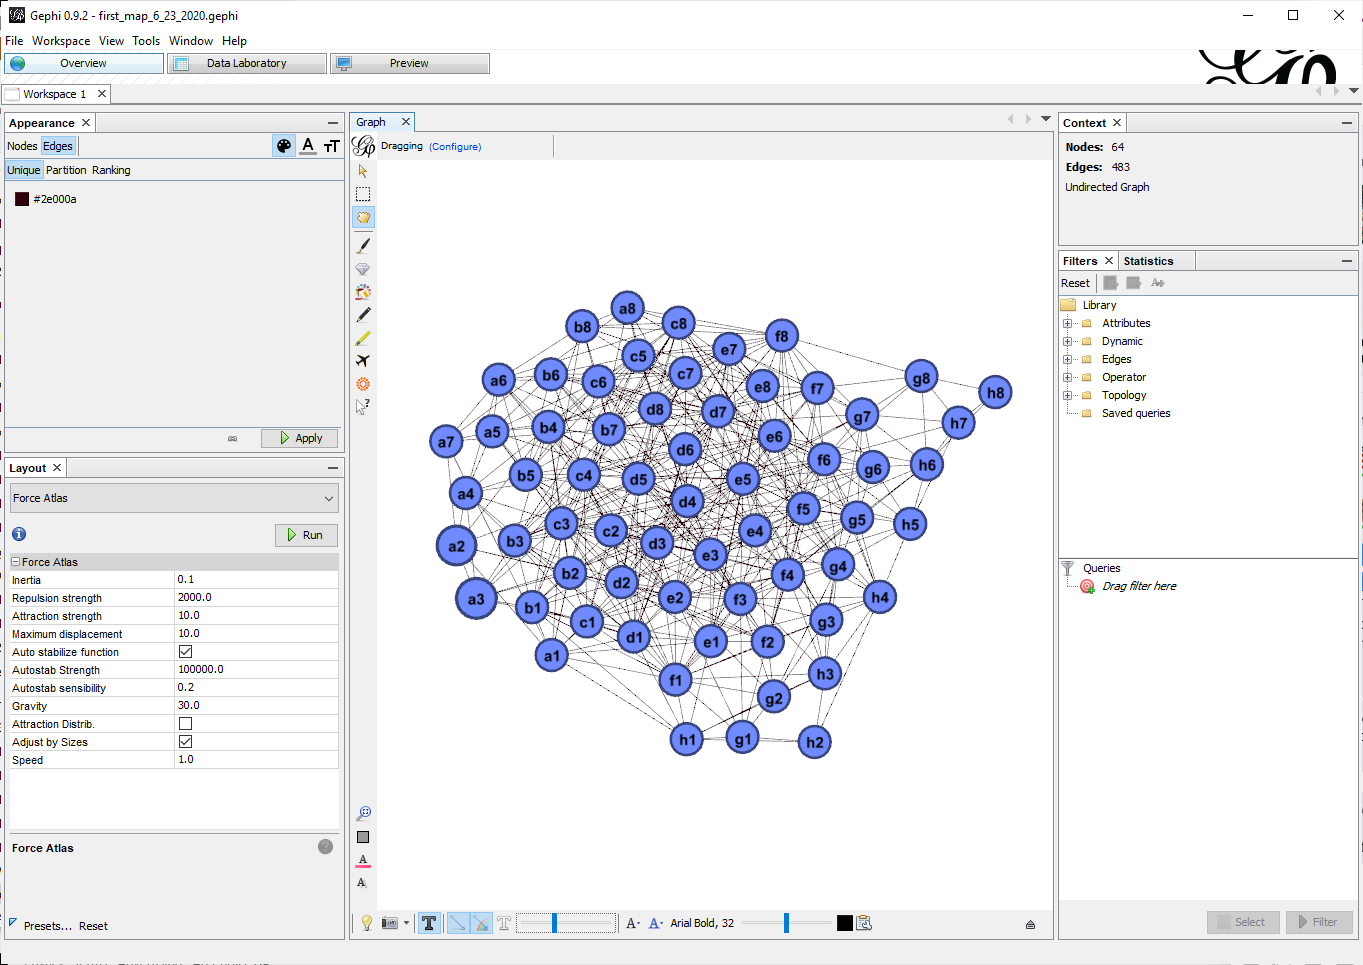
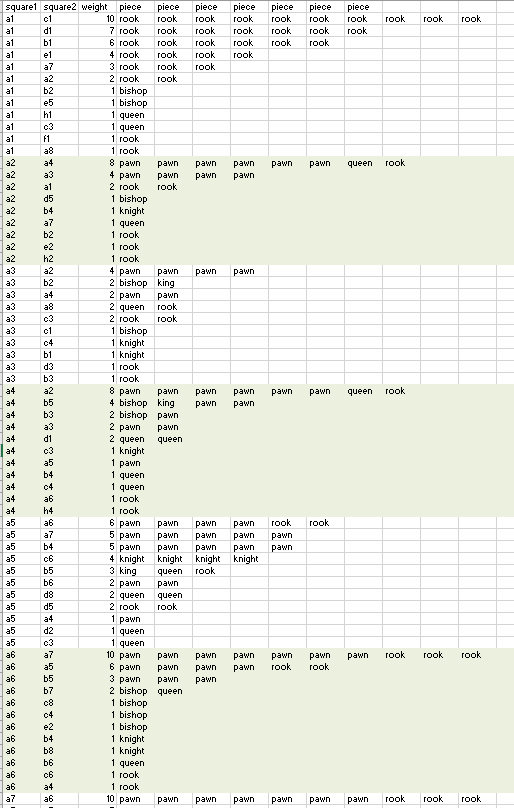
  • Add a menu that writes node spatial information to the DB
  • Add a “Graph from DB” menu that assembles the edge information from the move table and the node information from the new table, above.
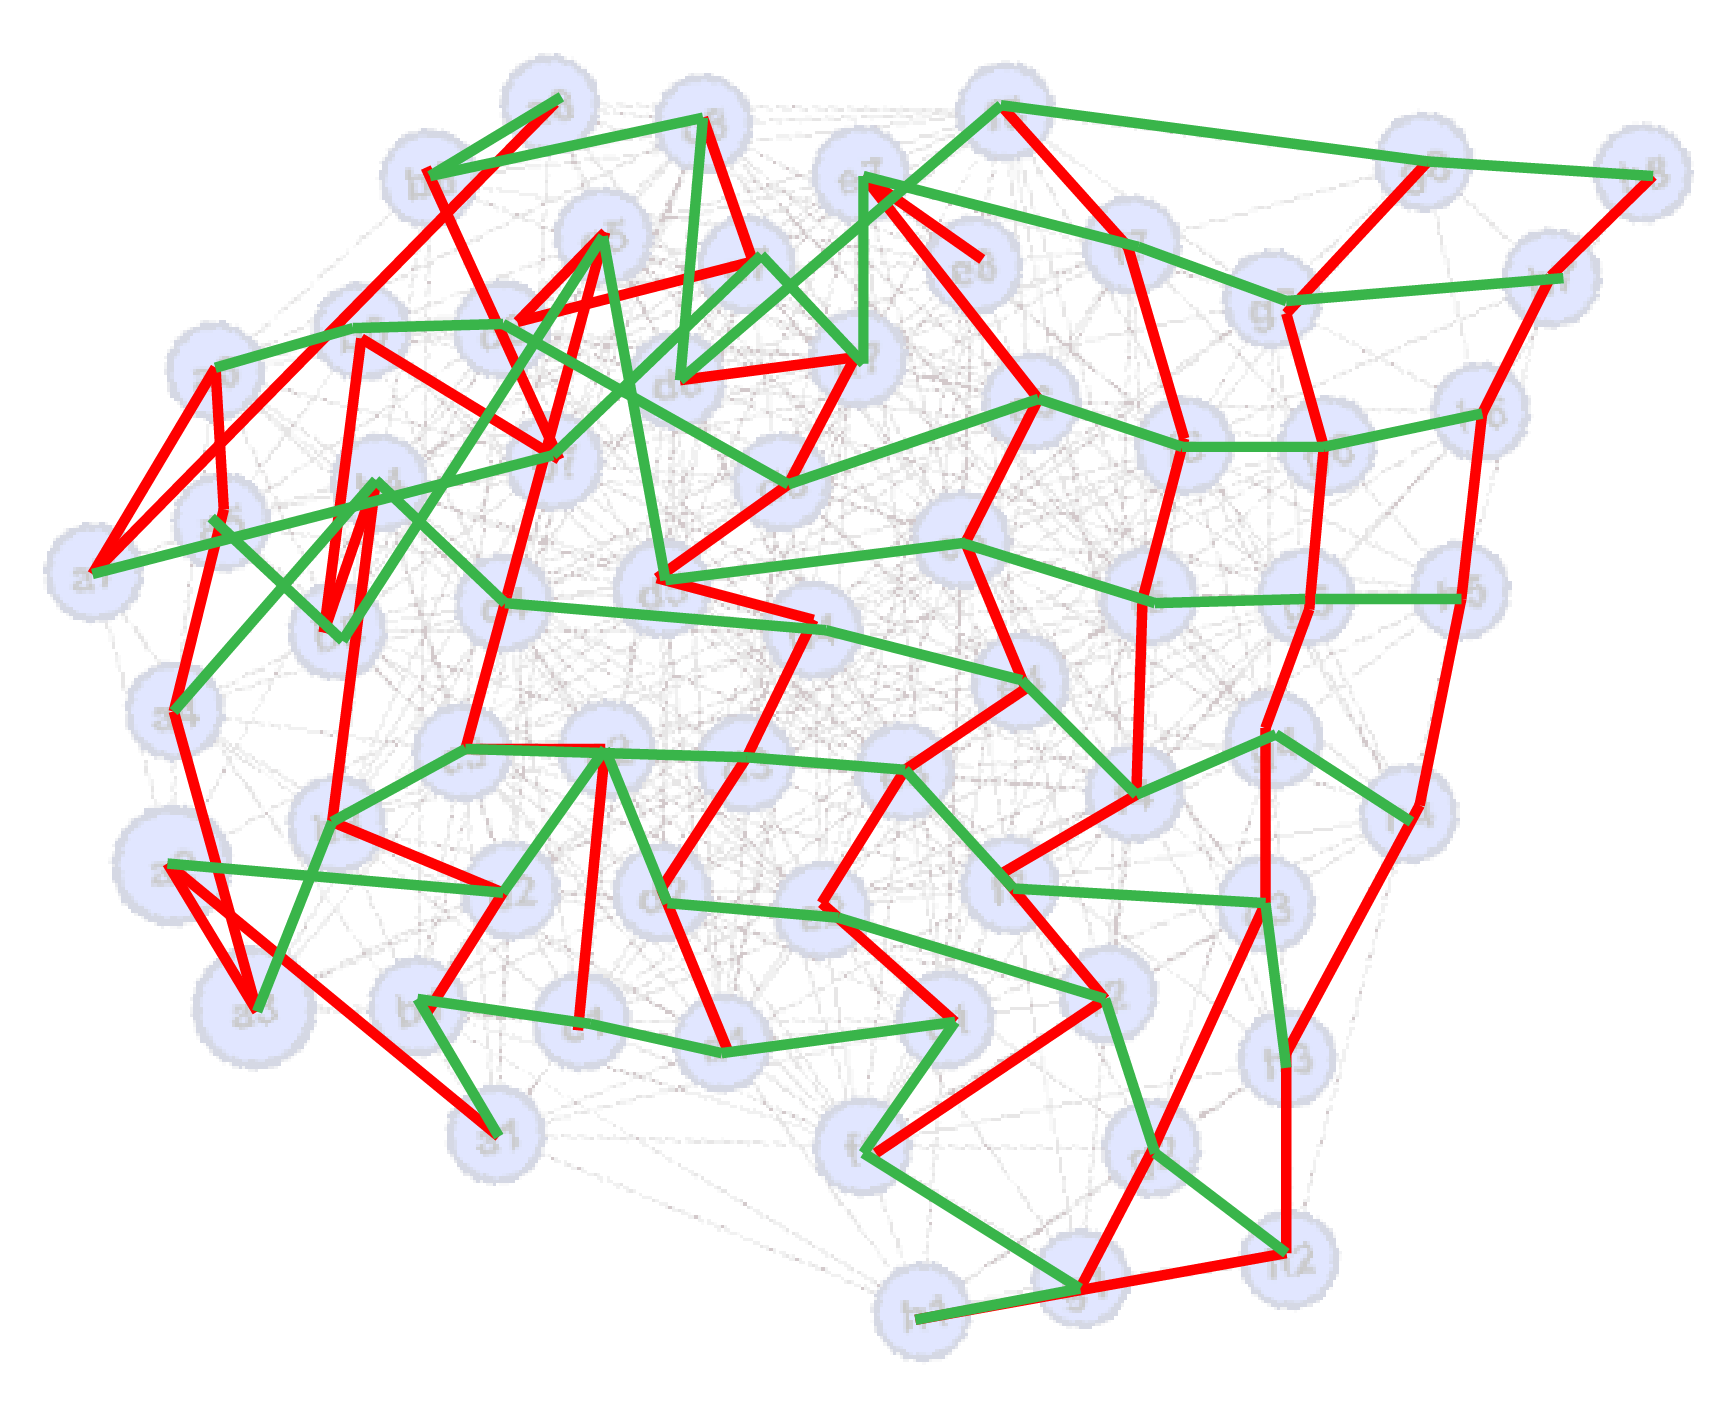
  • Continue on path finding
    • Distance between a point and a line using numpy  (stackoverflow). Not exactly what I need, which is the point of intersection and  the distance. There is a stackoverflow post that is close, but here’s a version that tests the results and plots it:
      import numpy as np
      import math
      import matplotlib.pyplot as plt
      
      p1 = np.array([1.0, 1.0])
      l1 = np.array([0.0, 1.0])
      l2 = np.array([1.0, 0.0])
      
      lvec = l2 - l1
      lvec /= np.linalg.norm(lvec, 2)
      
      p2 = l1 + lvec * np.dot(p1 - l1, lvec)
      print("intesection = {}".format(p2)) #0.2 1.
      
      pvec = p2 - p1
      dist = np.linalg.norm(pvec, 2)
      pvec /= dist
      det = np.linalg.det([lvec, pvec])
      dot = np.dot(lvec, pvec)
      rads = math.atan2(det, dot)
      print("distance = {}, angle = {}".format(dist, math.degrees(rads)))
      
      plt.plot([l1[0], l2[0]],[l1[1], l2[1]])
      plt.plot([p1[0], p2[0]],[p1[1], p2[1]])
      plt.show()
  • Here’s the test for seeing if a point is on a line. Again, loosely based on a stackoverflow post:
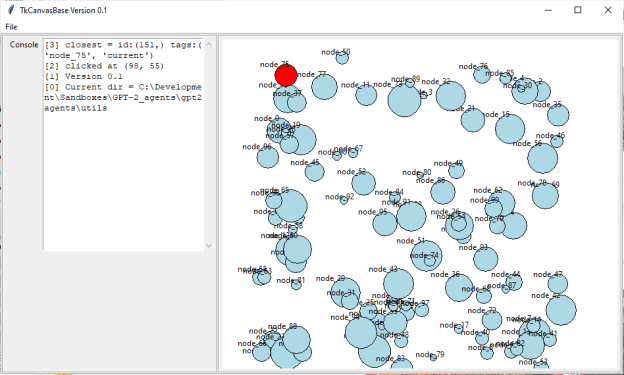
    def is_between(self, l1:[int, int], l2:[int, int], p1:[int, int], epsilon:float = .1) -> bool:
        p1 = np.array(p1).astype(np.float)
        l1 = np.array(l1).astype(np.float)
        l2 = np.array(l2).astype(np.float)
        
        s1 = np.linalg.norm(l1-p1)
        s2 = np.linalg.norm(l2-p1)
        d = np.linalg.norm(l2-l1)
        # print("d = {}, s1 + s2 = {}".format(d, s1+s2))
        if abs(d - (s1+s2)) < epsilon:
            return True
        return False
  • Got graphical node selection working. Need to tie that back into the menus for start and stop

Proposal

  • Looks like no writing today. Done, maybe?

GOES

  • 10:00 CASSIE demo – really good
  • 12:00 All Hands – need to catch up on my training. Something for the afternoons?

ML Seminar

  • Status report
  • Participated in some some triage on Arpita’s and Fatima’s paper

Phil 6.29.20

ACM IUI 2021 is the 26th annual premier international forum for reporting
outstanding research and development on intelligent user interfaces.

  • ACM IUI is where the Human-Computer Interaction (HCI) and Artificial 
    Intelligence (AI) communities meet, with contributions from related fields 
    such as psychology, behavioral science, cognitive science, computer 
    graphics, design, the arts, and more. Our focus is on improving the
    interaction between humans and digital technology, by leveraging both HCI
    approaches and state-of-the art AI techniques from machine learning,
    natural language processing, data mining, knowledge representation and
    reasoning.

GOES:

  • Ping Erik about collaborative VR coding environments. Done
  • 2:00 Meeting with Vadim
    • Walked through the deep hierarchy example
    • He’s now running 4 wheels and starting to get close, though the RW speed plots are not close to the actuals. It makes me think that there is more feedback control in the satellite implementation than there is implied in the documentation.

Proposal

  • After digging into the existing text, we realized that a lot of the technical sections were flat wrong, and depended on a kind of “magical ML thinking” that should have been in our phase III. So, lots of writing.

GPT-2 Agents

  • Working on trajectory plotting
  • Fix the listbox select. I was using the wrong event. It should be like this.

ListBoxSelect

  • Aaaand then there were a bunch of weird errors. For some reason, the call to a new ListBox also calls the previous ListBox with no args(?) so I get an error. Chased down and fixed.
  • Plot main line. Done!

NodeLine

  • Plot legal connections of closest lines
    • I think this can be done by looking at the nodes that are connected to the start (current) node, then looking at the coordinates of all the children. The one that is closest to the line and between the current and the target gets added to the list
    • Plotting all the node connections so there can be a sanity check:

NodeLine

  • Use the weight of the lines to choose the lines
  • Build a narrative rutter that describes the route (Here be there stampedes!)

Phil 6.26.20

Let’s not forget that things are not going well here:

DtZ

python_data_libs

Many useful links in the replies (like Stumpy for time series)

GPT2-Agents

  • Working on plotting nodes correctly, being able to select them, then plotting closest legal moves that reach a destination
  • Got node selection working!

2020-06-26

With loaded nodes as well. I have an issue where the callback from the mouse ius happening before the selection in a list, so I need to fix that:

2020-06-26 (1)

GOES

  • 10:00 Meeting with Vadim
  • Realized that I had been too fancy to remember how to deal with commands to individual controllers. Figuring that out now – done!

Book

  • Meeting with Michelle to discuss editing – went very well. Sent her a copy of the “book” version of the dissertation

Phil 6.25.20

Latent Embeddings of Point Process Excitations

  • When specific events seem to spur others in their wake, marked Hawkes processes enable us to reckon with their statistics. The underdetermined empirical nature of these event-triggering mechanisms hinders estimation in the multivariate setting. Spatiotemporal applications alleviate this obstacle by allowing relationships to depend only on relative distances in real Euclidean space; we employ the framework as a vessel for embedding arbitrary event types in a new latent space. By performing synthetic experiments on short records as well as an investigation into options markets and pathogens, we demonstrate that learning the embedding alongside a point process model uncovers the coherent, rather than spurious, interactions.

Misinformation, Crisis, and Public Health—Reviewing the Literature

  • The Covid-19 pandemic has been accompanied by a parallel “infodemic” (Rothkopf 2003; WHO 2020a), a term used by the World Health Organization (WHO) to describe the widespread sharing of false and misleading information about the novel coronavirus. Misleading information about the disease has been a problem in diverse societies around the globe. It has been blamed for fatal poisonings in Iran (Forrest 2020), racial hatred and violence against people of Asian descent (Kozlowska 2020), and the use of unproven and potentially dangerous drugs (Rogers et al. 2020). A video promoting a range of false claims and conspiracy theories about the disease, including an antivaccine message, spread widely (Alba 2020) across social media platforms and around the world. Those spreading misinformation include friends and relatives with the best intentions, opportunists with books and nutritional supplements to sell, and world leaders trying to consolidate political power.

GPT-2 Agents

  • Well, networkx can write a gefx file that Gephi can read, but not the other way around.
  • Networkx CAN read and write gml files, though. Switching to that.
  • That seems to be working well:

gml_read_write

  • Now let’s see if we can draw it in the app
  • Things are starting to get very specific. creating a subclass
  • Pulling attributes is not obvious. Here’s how you do it for the nodes read in from gml:
    attrs = nx.get_node_attributes(self.gml_model, 'graphics')
    for key, val in attrs.items():
        print("{} = {}".format(key, val))


  • Loading and displaying the nodes! Next, I need to get piece data from the database. Also, since the graphics attribute can be a dictionary, it may be possible to add attributes like that to the edge data? Then I won’t need to re-access the db. Conversely, another way to do this might be to update the table in the db with positions, etc. Hmmmm

GraphNavigator

GOES

  • 10:00 Meeting with Vadim. Nope, he broke his code. Rescheduled for tomorrow

Proposal

  • Work on technical section with Aaron?

Phil 6.24.20

GPT-2 Agents

  • Starting work on the navigator app
  • Today’s progress:

TkCanvasBase

  • I think that this can be the core of the initial navigation capability for any corpus. You should be able to identify a topic on the map or in the list, and the system will figure out the most direct route (linear distance).
  • I think there also needs to be an ability to see the directly connected neighbors as well, since they might be farther away due to mapping constraints. For example, we can see that d2 is linked directly to d7, which is almost completely across the board. This is the result of the white queen making a pretty aggressive move. It’s not common, but it does happen. It might be interesting for someone working their way from arithmetic to calculus to see, for example, how Johann Carl Friedrich Gauss did it:

nearest

GOES

  • 10:00 Meeting with Vadim
    • We’re going to try to get a single RW to move the vehicle through two successive 90-degree maneuvers, then verify that everything is working correctly on the other RWs, then go to RW sets
  • 2:00 Status meeting

Proposal

Phil 6.23.20

Oh, look, we’re not going to let smart, motivated people into the country and sabotage our future because, I dunno, being xenophobic trumps everything?

Collective Intelligence 2020

  • You can watch all the keynotes on our YouTube channel.
  • Conference proceedings (papers & presentations) are online here.

GPT-2 Agents

  • Working on getting Gephi installed and running everywhere.
  • Next is  to export graphs from networkx. Done! A little tricky. I’m using a dictionary attached to each node to store the pieces that traversed that particular edge, but the exporter chokes on that. So I have to create a new graph without the dict and export that. It looks pretty good too!

gephi_first_map

  • I’m going to import that into Illustrator and see if I can build a (distorted) chessboard. Here’s the result:

chess_nearest_neighbors_6_23_20

  • To get a sense of how this relates back to the ground truth of the chessboard, the red lines are the columns of the board (a – h) and the green lines are the rows (1 – 8). Here’s the comparison with the actual board:

chessboard

  • It’s clearly a grid. The opposite corners are far away from each other. The left (queen) side of the board is more complicated, which may be because of the queen?
  • I had a chat with Aaron about all of this and I think the next step is to show that this map can be used for meaningful navigation. Consider the following two trajectories from opposite sides of the map:

chessboard_trajectories

  • These are the kind of trajectories that you’d like to be able to plot on a map. Let’s say you’re on square A1, and you’re on a rook. For you, only row 1 and column A are directly accessible. But maybe you could ride a bishop from A3 to F8, then take a king the rest of the way. Now, the shortest number of moves could be to take the rook from A1 to A8 to H8, but the journey would cover a greater distance. In terms of belief space, you would not be making incremental shifts to your understanding, you would be making two, equally large jumps that combined are roughly 1.4 times farther than the more direct route. That’s the difference between navigating in space vs navigating in a network.
  • I think the next step is to write an app that reads in the GEFX files, which contain location information and link them back to the database, so it’s possible to plot a beginning and an ending, and have the app figure out the legal moves that move you near that line towards your destination.
  • After that, it’s time to finetune the NN on the antibubbles corpora and see if the same thing can be done.

GOES

  • Need to record a video of my talk for GVSETS
  • Sent a copy to Aaron for SBIR
  • Started looking at the SBIR materials

ML Seminar

Phil 6.22.20

Cornell University was having a sale, so I got a book:

Mental Territories

  • Rarely recognized outside its boundaries today, the Pacific Northwest region known at the turn of the century as the Inland Empire included portions of the states of Washington and Idaho, as well as British Columbia. Katherine G. Morrissey traces the history of this self-proclaimed region from its origins through its heyday. In doing so, she challenges the characterization of regions as fixed places defined by their geography, economy, and demographics. Regions, she argues, are best understood as mental constructs, internally defined through conflicts and debates among different groups of people seeking to control a particular area’s identity and direction. She tells the story of the Inland Empire as a complex narrative of competing perceptions and interests.

DtZ:

  • Change the code so that there is a 30 day prediction based on the current rates regardless of trend. I think it tells the story of second waves better:

30_days

GPT-2 Agents

  • The ACSOS paper was rejected, so this is now the only path going forward for mapmaking research.
  • Used the known_nearest to produce a graph:
  • The graph on the left is the full graph, and the right is culled. First, note that node c is not in the second graph. There is no confirming link, so we don’t know if it’s an accident. Node e is also not on the chart, because it has no confirming link back through any 2-edge path.
  • Ok, I tried it for the first time on the chess data. There is a bug where [a-h] and [1-8] are showing up as nodes that I have to figure out. But they show up in the right way! Orthogonal and in order!

chess_nearest_bug

  • The bug seems to be in the way that List.extend() works. It seems to be splitting the string (which is a List, duh), and adding those elements as well? Nope, just doing one nesting too many
  • Ok, here are the first results. The first image is of all neighbors. The second is of only verified nearest neighbors (at least one edge chain of 2 that lead back to the original node)

chess_all_neighbors

chess_nearest_neighbors

  • In both cases, the large-scale features of the chessboard are visible. There is a progression from 1 to 8, and a to h. It seems clearer to me in the lower image, and the grid-like nature is more visible. I think I need to get the interactive manipulation working, because some of this could be drawing artifacts
  • Trying out the networkx_viewer. A little worried about this though:

networkxviewer

  • And rightly so:

kablooee

  • Going to try cloning and fixing. Nope. It is waaaaaaayyyyyy broken, and depends on earlier version of networkx
  • Networkx suggests Gephi, and there is a way to export graphs from networkx. Trying that
  • Seems usable?

Gephi

GOES

  • Kind of stuck. Waiting on Vadim
  • Probably will be working on a couple of SBIRs for the next few weeks

Phil 6.19.20

stampede

12:00 – Sy’s defense at noon!

GPT-2 Agents

  • Fixed the regex in ChessMovesToDb
  • More work on finding closest neighbors.
    • Maybe keep a record of the number and type of pieces that are used?
    • Looks like the basics are working. Here’s the test graph:

known_nearest

    • And here are the results. I made the code so that it only shows each neighbor once, but it may be useful to keep track of the number of times a neighbor shows up in a list. This might not be important in chess, but in less structured text environments (RPGs to Reddit threads), it may be valuable:
      find_closest_neighbors(): nodes = ['a', 'b', 'c', 'd', 'e', 'f', 'g']
      {'node': 'a', 'known_nearest': ['f', 'd']}
      {'node': 'b', 'known_nearest': ['f', 'd']}
      {'node': 'c', 'known_nearest': []}
      {'node': 'd', 'known_nearest': ['f', 'a', 'b', 'g']}
      {'node': 'e', 'known_nearest': []}
      {'node': 'f', 'known_nearest': ['a', 'g', 'd', 'b']}
      {'node': 'g', 'known_nearest': ['f', 'd']}


    • At this point it’s not recursive, but it could be. I’m worried about combinatorial explosion though

GOES

  • Submit GVSETS paper – done!
  • Meeting with Vadim and Issac at 11:00
    • Goal is to move all the RW code out of the sim class and into its own and call methods from the sim class

Phil 6.18.20

Hotel reservations!

Sent a ping to Don about a paper to review

GPT-2 Agents

  • Started on common neighbor algorithm. Definitely a good place for recursion
  • Generating larger file

adjacency

moves

  • If you look at the center of the plot and squint a bit, you can see a bit of the grid:

networkx

  • There is an error: The string ‘, White moves pawn from h3 to g4. White takes black pawn. LCZero v0.24-sv-t60-3010 moves black knight from h5 to g7. White moves pawn from g4 to h5. LCZero v0.24‘ is parsing incorrectly due to the truly bizarre name (The little known Grand Master LCZero v0.24-sv-t60-3010). Need to fix the regex. I think I just need to make it so that there has to be a space in front and a space/period after.

GOES

  • Readthrough of GVSETS paper
  • 2:00 Meeting

Waikato

  • Alex had a really good insight in that groups that are working at coming to consensus use terms to discuss their level of agreement that are independent of the points being argued. That’s could really be important in text analysis.

Phil 6.17.20

Listened to a fantastic interview with Nell Irvin Painter (White Supremacy at Home and Abroad):

GPT-2 Agents

  • Working on finding the connections between nodes
  • Now that I know how to add weights to edges, I think I want to add the piece that made the move. It needs to be a list, since multiple types of pieces can connect two squares. Added a dict_array per edge:
    if target not in nlist:
        self.G.add_edge(source, target, weight=0)
        self.G[target]['dict_array'] = []
    self.G[target]['weight'] += 1
    for key, val in data_dict.items():
        a:List = self.G[target]['dict_array']
        a.append({key:val})
  • I also realize that moves that repeatedly connect squares are more likely to be close, simply because the available squares of more distant moves increase in a geometric fashion. I added a method that writes out moves to Excel where I can play with them. Here are some moves:

moves

  • In looking at these moves, it does seem to be that the majority of the moves seem to be short (e.g. b6-b7, b6-a7, b6-b5). The only exception is the knight (b6-d7). So I think there is a confidence value that I can calculate for the ‘physical’ adjacency of nodes in a network. This could also apply to belief spaces as well. Most consensus requires coordination and common orientation (pos, heading, speed), so commonly connected topics can be said to be ‘closer’
  • Good chat with Aaron about CVPR and algorithms

GOES

  • Finish revisions and send to T and Aaron for review. Last thing is to tie back to ground vehicles in the discussion. Done! I think… Need to read the whole thing and see if it still hangs together
  • 2:00 – Meeting

Phil 6.15.20

The nice thing about riding big distances is that even though nothing has changed, everything is different and better for a while

therapy

GPT-2 Agents

  • Try to make a adjacency matrix from the DB. That may work, but it sure doesn’t generate anything human-readable. Need to roll my own
  • After accidentally blowing away my database (Yay, backups!), I’m reading in the network. This actually looks really good. I’d not an 8×8 grid, but the system found 63 nodes, and you can see that many adjacent nodes are connected:

networkx

  • You can also see that common moves, such as e2 and d2 are in the center and well connected.
  • Hand-rolled an adjacency matrix using pandas.DataFrame and exported to Excel. I have to think about what this means now. I think that it’s clear that moves tend to be nearby. I’m clearly not setting something right, because I don’t have the weight of the edge between nodes (I’m currently using the number of times a node was visited). Now I need to figure out how to use this:

adjacency

GOES

  • Continue with revisions
  • After trying the pipeline image, (very small text and pix!), I’m going to try a new, more vertical layout. I think this is a little better. It’s a lot more legible:
pipeline_vert2

Enter a caption

  • Ok, back to writing actual text

Good chat with Aaron about the Conspiracy as mode collapse experiments

Fika

  • Sy’s Presentation

Phil 6.12.20

Hey! My dissertation is online now!

Optimizing Multiple Loss Functions with Loss-Conditional Training

  • The idea behind our approach is to train a single model that covers all choices of coefficients of the loss terms, instead of training a model for each set of coefficients. We achieve this by (i) training the model on a distribution of losses instead of a single loss function, and (ii) conditioning the model outputs on the vector of coefficients of the loss terms. This way, at inference time the conditioning vector can be varied, allowing us to traverse the space of models corresponding to loss functions with different coefficients

GPT-2 Agents

  • Applied to get on the OpenAI API waitlist
  • Started figuring out igraph. Welp, it doesn’t plot because cannot load library ‘libcairo-2.dll’: error 0x7e Diesn’t seem to be a good fix. It’s a shame, because igraph seems to be great for analyzing graphs mathematically. Removing everything
  • Looks like I can use networkx combined with networkx_viewer (pypi)(github). Look into that next. Upgraded from 2.1 to 2.4
  • Pulled my NetworkxGraphing.py class over from Antibubbles and verified that it still works!

networkx

GOES

  • Send Jason my download code
  • Work on GVSETS paper
    • Added formatting changes and moved footnotes to citations
    • Adding a figure for the pipeline. Hmmm. It’s um… big

pipeline

Phil 6.11.20

Call Simon

GPT-2 Agents

  • Embeddings and plots
  • Got the sequences generated. They look pretty cool too, like codes:
    e2 e4 c7 c5 g1 f3 b8 c6 d2 d4 c5 d4 f3 d4 g7 g6 b1 c3 f8 g7 f1 e2 d7 d6 c1 g5 a7 a6 d1 e2 f6 e8 f2 f3 e8 c7 g5 f4 f7 f5 e4 f5 g6 f5 e2 f3 c7 d5 f3 g4 c8 d7 e2 d2 d8 c7 b2 b3 f5 f4 d4 b3 d7 f5 f1 e1 e7 f5 e1 e6 f5 g4 b3 d4 a8 c8 d4 f5 c6 f5 e6 f6 f5 d4 a1 e1 g4 h5 f3 f4 f8 f6 d2 f6 c8 f8 f6 h4 d4 e6 c2 c3 e6 d4 c3 d4 h5 f3 e1 e7 f8 f7 e7 f7 g7 f7 g1 f2 b7 b5 c4 b5 a6 b5 g2 g4 f7 g6 h2 h3 g8
    e2 e4 c7 c6 d2 d4 d7 d5 b1 d2 g8 f6 f1 d3 d5 e4 d2 e4 b8 d7 g1 f3 e7 e6 d1 e2 f6 e4 d3 e4 d8 c7 e4 b1 d7 f6 c1 g5 f6 g4 h7 h6 g5 h4 c7 d7 e2 e3 g4 e5 h1 g1 e5 c6 f2 f3 f8 e7 e3 e2 g2 g4 f8 d8 f3 e5 d7 d3 e2 d3 d8 d3 g1 d1 a7 a6 c1 b1 d3 d6 b1 a1 e7 f6 a2 a3 c8 e6 f3 e4 b7 b5 b2 b4 f6 g7 b4 a5 b5 a4 e5 c6 a8 b8 d1 f1 a4 a3 c6 e5 a3 a2 h4 e1 a2 a1 f1 a1 b8 a1 d4 d5 e6 c8 d1 b1 g8 f8 a1 b1 f8 e7 b1 c2 e7 d6 e5 d7 g7 d4
    e2 e4 e7 e6 d2 d4 d7 d5 b1 c3 f8 b4 e4 e5 b4 c3 b2 c3 g8 e7 d1 b3 c7 c5 a2 a3 b8 c6 f2 f4 b7 b5 a3 a4 b5 b4 b3 b2 a4 a5 c5 d4 c3 d4 e7 g6 g1 f3 c6 e7 c8 a6 c1 g5 e7 g8 a1 b1 a8 c8 e5 d6 g8 f6 g5 f6 d8 f6 f1 f2 h7 h6 b2 b5 f6 d6 f3 h4 d6 e7 h4 g6 a6 g2 g6 e7 f8 e8 e7 f5 g2 f3 g1 g2 c8 c2 b1 c1 c2 c8 a5 a6 c8 a8 h2 h3 f3 e4 b5 b3 f7 f6 b3 b2 f6 f5 f5 d6 e6 e5 b2 a1 e8 a8 f2 f5 f5 e4 f5 f7 a8 b8 c1 f1 b8 b5 a1 a2 a8 a7
    e3 d2 d4 g8 f6 c2 c4 e7 e6 b1 c3 f8 b4 e2 e3 c1 d2 d7 d5 c4 d5 f6 d5 f2 f3 b8 c6 g1 f3 f7 f5 g2 g4 f5 g4 d1 e2 d5 f4 d2 f4 e6 f5 e2 e5 b4 c3 e5 c3 d8 d3 e1 e2 d3 e2 e2 e2 f5 f4 e2 e1 f4 f3 e1 f2 a8 d8 f2 f1 c8 e6 f4 e3 f8 f7 f3 h4 e6 d5 f1 g2 f7 f3 g2 f1 f3 h3 f1 e1 d5 e4 e1 f2 h3 h4 g4 h5 h4 h5 f2 f3 h5 f5 f3 g2 f5 h5 e3 g5 h5 h3 g5 e3 h3 h4 e3 g5 e4 g2 g2 g3 g2 d5 g3 h3 d5 e6 g5 f6 g8 h7
    e2 e4 e7 e5 g1 f3 b8 c6 b1 c3 g8 f6 f1 b5 d7 d6 d2 d3 a7 a6 f8 e7 b5 a4 b7 b5 a4 b3 h2 h3 c8 b7 a2 a4 b5 b4 a4 b5 c6 b8 c1 g5 f6 e8 f3 e5 e8 d6 g5 f4 d8 e7 f4 d6 e7 d6 e5 f3 d6 e7 c3 a4 c7 c6 a4 c5 c6 c5 d3 d4 e7 e5 d4 c5 b7 c8 a1 c1 b8 d7 f3 e5 f7 f6 e4 f5 d7 f6 c1 c6 e5 e4 g1 h1 f6 h5 f1 e1 h5 g3 e5 d7 e4 h4 c6 c4 h4 g3 d1 g4 g3 h3 h1 g1 h3 h1 g1 h2 h1 h5 g4 f5 c8 b7 c4 c5 h5 e2 e1 d1 e7 f6 b2 b3 f6 e5 c5 c8 a8 c8


  • Drawing the embeddings. Fun, but not really useful. And this is kind of my point about embeddings like W2V that don’t take into account the trajectory of the sentence the word is part of. We know that the structure of the board is represented in the text. We need a more sophisticated embedding to to extract it

square_embeddings

  • Something that might make sense is to see how these points cluster as well
  • I think I might try plotting individual columns later, but first I’m going to try building some from/to networks by piece

GOES

  • Try downloading yaw flip
  • Was able to connect to the server, though now I don’t need a port number?
  • Specifying the queries. Fixed a few mnemonics.
  • Had to try a few times, but I got it!

influx_copy

  • Not sure what to do next. Update GVSETS paper?
  • 2:00 CASSIE meeting – learned a lot of things
  • I got promoted!
  • Implemented a perplexity measure. Looking at this as a way of understanding mode collapse, and maybe conspiracy theories?
  • Done for the day