Phil 1.20.17

7:00 – 7:45 Research

9:30 – 5:00 BRC

  • Updated all the CSEs
  • Working through loading of config files. Far too fancy, but killing time before the review. Which has been delayed to 2:00. With technical difficulties, 2:?? Canceled.
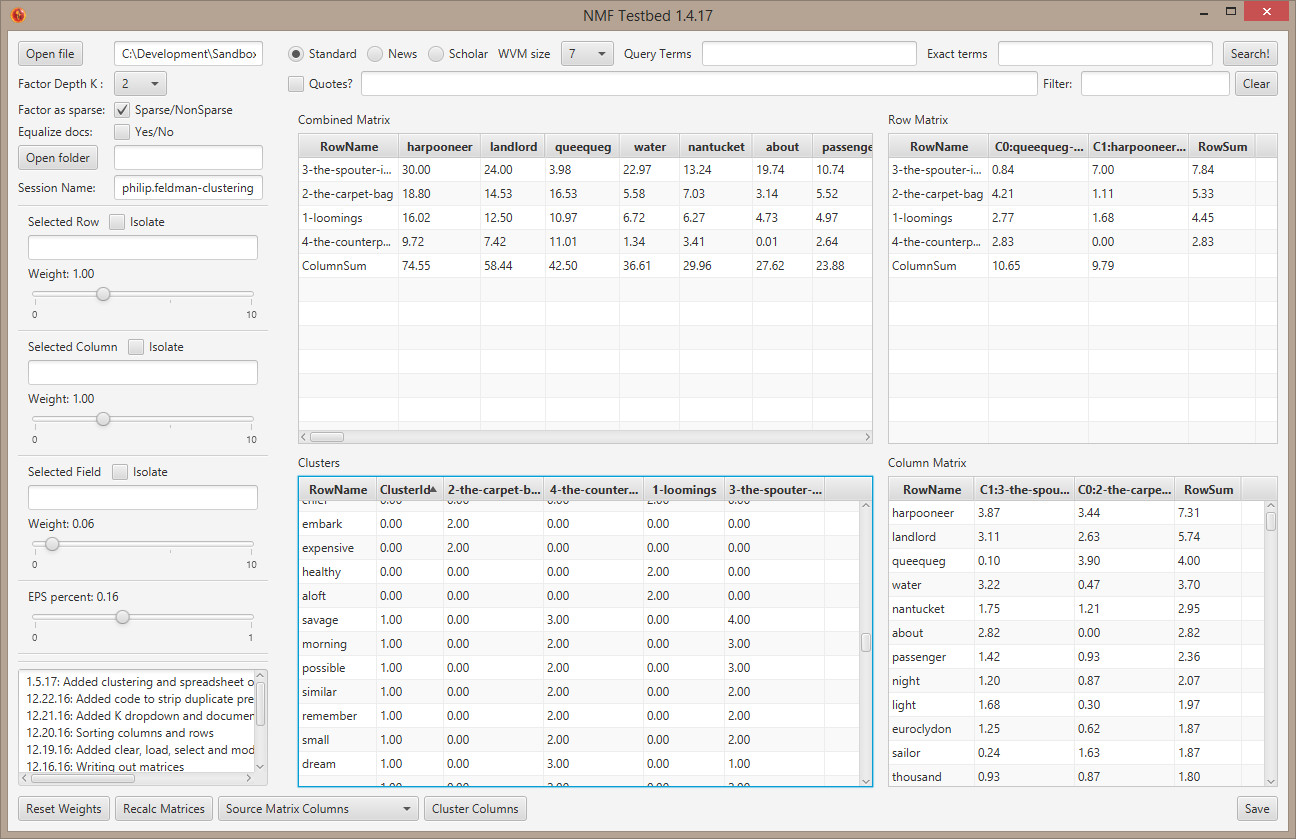
  • For the review, read in integrity1.xlsx. It’s small enough to load reasonably quickly
  • Loading config files!

Phil 1.19.17

7:00 – 8:00 Research

8:30 – 3:30 BRC

  • Updated Java, recompiled and verified everything
  • Working on classifying clusters
    • Adding multiple config loads
    • Need to add a “settling time” before recording starts automatically

Phil 1.18.177

7:00 – 8:00, 8:30 – 3:30 Research

  • Working title Interpreting ‘The Law of Group Polarization” with flocking behavior
    • Multidimensional exposes information distance and diversity issues (low dimensions = easier flocking, and the converse)
    • Reynolds-style flocking behavior means that agreement is not a static value, but changes. This brings up questions about how to identify GP, particularly in high dimensions
    • Adjusting social horizons results in three states (Phase change)
      • Random
      • Flocking
      • Polarized Group
    • The impact of visible diversity of GP.
    • Machine learning for identification of states/types
  • Wired up RunConfig to support border types
  • Closing the loop with Tim Champ for server space at UMBC
  • Downloaded the format and created a CollectiveIntelligence 2017 folder. Looking back through the 2015 conference, there were visible abstracts. Going to read a few to get a sense.
  • Uploaded the executable jar https://philfeldman.com/GroupPolarization/GroupPolarizationModel.jar
  • Adding ARFF output – done! First try:
    === Stratified cross-validation ===
    === Summary ===
    
    Correctly Classified Instances          98               98      %
    Incorrectly Classified Instances         2                2      %
    Kappa statistic                          0.898 
    Mean absolute error                      0.02  
    Root mean squared error                  0.1414
    Relative absolute error                 10.6977 %
    Root relative squared error             47.1207 %
    Total Number of Instances              100     
    
    === Detailed Accuracy By Class ===
    
                     TP Rate  FP Rate  Precision  Recall   F-Measure  MCC      ROC Area  PRC Area  Class
                     1.000    0.022    0.833      1.000    0.909      0.903    0.989     0.833     EXPLORER
                     0.978    0.000    1.000      0.978    0.989      0.903    0.989     0.998     EXPLOITER
    Weighted Avg.    0.980    0.002    0.983      0.980    0.981      0.903    0.989     0.981     
    
    === Confusion Matrix ===
    
      a  b   
     10  0 |  a = EXPLORER
      2 88 |  b = EXPLOITER
  • One run vs another, using average angle difference:
    === Summary ===
    
    Correctly Classified Instances          96               96      %
    Incorrectly Classified Instances         4                4      %
    Kappa statistic                          0.8837
    Mean absolute error                      0.04  
    Root mean squared error                  0.2   
    Relative absolute error                 12.3636 %
    Root relative squared error             49.9946 %
    Total Number of Instances              100     
    
    === Detailed Accuracy By Class ===
    
                     TP Rate  FP Rate  Precision  Recall   F-Measure  MCC      ROC Area  PRC Area  Class
                     1.000    0.050    0.833      1.000    0.909      0.890    0.975     0.833     EXPLORER
                     0.950    0.000    1.000      0.950    0.974      0.890    0.994     0.998     EXPLOITER
    Weighted Avg.    0.960    0.010    0.967      0.960    0.961      0.890    0.990     0.965     
    
    === Confusion Matrix ===
    
      a  b   -- classified as
     20  0 |  a = EXPLORER
      4 76 |  b = EXPLOITER
  • Need a checkbox for cross-bias interaction. Done! Now I can train against two populations with and without interactions
  • Spreadsheet with new tabs and some nifty charts: meanangletest_01_18_17-14_07_32

3:30 – 4:30

  • Walked through scoring issues with Aaron
  • Realized that the above work can be used for classifying clusters with ML.

Phil 1.17.17

Shower thought for today: The social horizon for flocking to occur is sqrt(dimensions)*k. This means the lower the number of dimensions, the easier to flock, while higher dimensions (i.e. more diverse) make flocking harder. Conversely, by watching the flocking behavior of individuals, it may be possible to infer the number of dimensions they are paying attention to.

Collective intelligence conference. Abstracts are 4 pages. Format is here, and here’s the program with abstracts from 2016. Need to dig up a password

7:00 – 8:00 Research

  • Procrastinating about writing. I think I want to have some of the different border conditions in place to see if there is any effect.
  • Made a ACTIVE, INACTIVE and DORMANT state.
    • ACTIVE is moves and is visible
    • INACTIVE is not visible, effectively removed from all interaction. Hitting a lethal boundary sets state to INACTIVE
    • DORMANT is visible, but not active
    • Added the combo and config
    • Set behavior so that moving requires an ACTIVE state and visibility requires a non INACTIVE state
    • Need to wire up border behaviors and set colors for DORMANT (gray) and INACTIVE (black)
  • Fixed the bug where a re-initialized run was repeating the same data.

8:30 – 5:00 BRC

  • Working on documentation. Done!
  • Made a few changes to NMFGui to improve saving and parsing .

Phil 1.16.17

7:00 – 8:00 Research

  •  Walls
    • infinite
    • fatal
    • force at a radius
    • toroidal with distribution across the torus
  • Look for data sets
    Sentiment analysis flocking on a twitter subject
  • Add ‘samples’ indicator – done
  • Add some kind of live/dead state for lethal walls
  • Tried recording a 10D run and had to reset. Recorded the same item for the entire run.
  • Isolating and weighting are broken. Need to fix.

8:30 – 5:00 BRC

  • Cleaning up IntegrityMatrixBuilder enough so that it can be checked in. Done
  • Working on documentation. Worried about scope creep and having to document EVERYTHING
  • My openVPN is denied again, so can’t connect to the remote DB?
  • Built new clusters on Aaron’s machine

Phil 1.15.17

  • Make sure that distance calculations are double buffered. I think this can be done bay have a ‘cur’ and ‘previous’ ParticleBelief
    • Added prevBelief and curBelief.
    • added deepUpdate() method to ParticleBelief
    • No change. Yay!
  •  Walls
    • infinite
    • fatal
    • force at a radius
    • toroidal with distribution across the torus
  • Look for data sets
    Sentiment analysis flocking on a twitter subject
  • Add ‘samples’ indicator
  • Add some kind of live/dead state for lethal walls

Phil 1.13.17

7:00 – 8:30 Research

  • First research runs
  • All Exploit
    • No group visibility (NGV R = 0)
    • Partial group visibility (PGV R = 0.1 )
    • Partial group visibility (PGV R = 0.2 )
    • Partial group visibility (PGV R = 0.4 )
    • Partial group visibility (PGV R = 0.8 )
    • Full group visibility (FGV R = 10.0)(
  • 10% Explore (NGV R = 0) / 90% Exploit
    • Exploit (PGV R = 0.1 )
    • Exploit (PGV R = 0.2 )
    • Exploit (PGV R = 0.4 )
    • Exploit (PGV R = 0.4 )
    • Exploit (FGV R = 10.0 )

9:00 – 3:30 BRC

  • Created mbrnum_cluster.csv for Bob to look at
  • Spent the rest of the day fixing the csv file. mbrnum should have been mmberrow, no spaces, etc.
  • Tried a rollup of diagnosis codes, which produced more clusters. Using that as a first pass

4:00 – 5:00 Meeting with Don

  • Make sure that distance calculations are double buffered. I think this can be done bay have a ‘cur’ and ‘previous’ statementList inside of ParticleBelief.
  •  Walls
    • infinite
    • fatal
    • force at a radius
    • toroidal with distribution across the torus
  • Look for data sets
    Sentiment analysis flocking on a twitter subject

Phil 1.12.17

7:00 – 8:30 Research

  • Set up page that shows the 5th, 50th and 95th percentiles for each statement’s population sample. Put in a new tab.
  • Add a tab that shows the 5th/95th – the 50th? That could sum to a nice chart
  • The above two items will need a Collection of Percentiles for all agents positions at a step across all dimensions. Done. Charts look cool, too. Will generate data tomorrow and load up the laptop for chat with Don. echochambertest

9:00 – 5:00 BRC

Phil 1.11.17

7:00 – 8:00 Research

  • Add a frame sampling text field. Default of 10? Zero = sample. Hitting the limit = reset sampleIncrement to zero. Done. Found a bug that screwed up the average center calculation:
    globalCenter.add(arv);

    Should have been

    globalCenter = globalCenter.add(arv);
  • Set up page that shows the 5th, 50th and 95th percentiles for each statement’s population sample. Put in a new tab.
  • Add a tab that shows the 5th/95th – the 50th? That could sum to a nice chart
  • The above two items will need a Collection of Percentiles for all agents positions at a step across all dimensions. Tomorrow

9:00 – 5:00BRC

  • Try using MySQL instead of postgres. Nope, pointless
  • Maybe save as CSV? Changed the toString() method to be a toWriter(Writer writer) method. Now toString calls that with a StringWriter and toCSV calls it with a BufferedWriter()
  • Use “output folder” as database/schema. Then session becomes the table. Will need to check that the db/schema exists and create as needed
  • Output the list of items with clusterId(+1) for Bob
  • Reduce the size of the matrix by eliminating all non-cluster members? Can certainly do this in the display of the cluster matrix.
  • Left with the NMF app cooking for a 4-level deep set of matrices. Hmm. Blew up with NaNs. Test cases work fine. I’ll try scaling up slowly

Phil 1.10.17

7:00 – 8:00 Research

  • Change influence multiplier to another social influence horizon
  • Add a LINEAR and EXPONENTIAL mapping to the WeightWidget
  • Rolled up the configuration variables into a single class and broke a lot of things. Fixed now

Call Senator Cardin about obstruction – done

8:30 – 5:00 BRC

  • Downloaded the new data
  • Extracting clusterable data from view
  • low values appear to be best for these clusters
  • Exploded excel
  • Exploded postgres “org.postgresql.util.PSQLException: ERROR: tables can have at most 1600 columns”
  • Need to try MySql. Enough columns for now. O just write out the row names and clusters. Except we can’t do a sniff test that way Grr.
  • Sprint 13 recovery meeting
  • Fixed tasks in Jira

Phil 1.9.17

7:00 – 8:00 Research

  • Added dimensions. The behaviors from 2D are evident at up to 10 dimensions, though everything takes longer. It is hard to see what’s going on in my simple 2D mapping scheme.
  • After playing with the explorer settings some yesterday, I’m not sure what to do with it. I think the abstract instead should just consider the initial modelling of group polarization in a homogeneous population. There are three conditions:
    • Isolated – Each agent only pays attention to its previous state. Creates a uniform random distribution. I think this is the archetypal ‘explorer’ pattern, where path through information space is not affected by social activity
    • Limited social visibility – Each agent can see other agents up to a specified distance. This produces multiple flocks (usually one large and several smaller) that orbit a center.
    • Infinite social visibility – Every agent can see every other agent. This leads to one large flock that moves in a straight line
  •  So yesterday, I was thinking that the most ‘socially sensitive’ agents would be the explorers, but after writing the above, I realise that it’s the reverse. Explorers are least socially sensitive. To test this, I set the ‘explorer multiple’ to a very low value and cranked up the social visibility for the rest of the agents. This creates a new behavior, where the tightly clustered social agents are more ‘anchored’ to the environment and stay closer to the center of the stage, depending on local concentrations of explorers. Interestingly, this implies that the greater percentage of explorers (up to a point?) means a more grounded group of social ‘exploiters’. Which is pretty interesting.
  • Going to try to get ahold of Don to go over these results. Sent email
  • Another thought. In addition to the average center, do the variance? Not sure how to do this. Axis-by-axis? Actually, that would work nicely, with center and variance by dimension.

8:30 – 4:00 BRC

  • Working on clustering the current data, waiting on DB updates
  • Took care of my fall 2016 and spring 2017 education paperwork
  • Asked Gregg for the  updated DB
  • Set up LMN to access the DB.
  • Have jdbc running. I feel so ’90s
  • Built the view:
    CREATE VIEW v_fused AS
      SELECT ecp.mbrnum,
        claim.chargeamount, claim.benefittype, claim.physicianname, claim.provpayeename, claim.provfirstname, claim.provzp,
        claim.rxdrugname,
        claim.diagnosiscode1, claim.diagnosiscode2, claim.diagnosiscode3, claim.diagnosiscode4, claim.otherdiagnosiscodes,
        coveragetype, membergender, flab_hrt, flag_acuterenal, flag_bactinf, flag_cerebrovascular,
        flag_chf, flag_ckd, flag_cnc, flag_copd, flag_fluidelec, flag_htn, flag_otherheart, flag_pleurisy,
        flag_respfailure, flag_surgothercomps, flag_whitebloodcell
      FROM tbl_eligibility_chiroacup_polyrx AS ecp
        JOIN tbl_medicalclaims_chiroacup_polyrx claim on ecp.mbrnum = claim.mbrnum;
  • Now I need to code up the extractor. Change all the Yes -> 1, NULL -> 0, build a map of all the strings and make a column for each, then map into that as a Labled2DMatrix, with the row being mbrnum. Then create a spreadsheet. Might be too big. Maybe create a table and read the table directly into the Labled2DMatrix. Kinda like that option…

Phil 1.8.17

11:00 – 2:00 Research

  • It is currently 19 degrees F, which is way too cold to play outside. So…
  • Make a Explorer and Exploiter flock – done
  • Make a slider that sets the ratio of Explorer to Exploiter – done
  • Make a slider that sets the Explorer as a multiple of the Exploiter – done. Not sure that these shouldn’t just be set explicitly
  • Add some dimensions
  • Added ConfigRecordingClass to hold all these values and pass them around
    • Bug where a paused sim is still recording
    • ratios are in and working
    • Need to add code implementing
      • multipliers – done
      • dimensions

Phil 1.6.17

7:00 – 8:00 Research

  • Wiring up the recorder – Done!
  • Need to add a deltatime component and ComboBox to set the sampling step size
  • Results!

8:30 – 5:00 BRC

  • Implement the search on the top terms so we can use google to figure out meaning
  • Start looking at data and cluster.
  • The integrity test data is big and too slow for interactive rates. Added an ‘interactive’ check.
  • Make NMF calculation optional by checkbox. If it’s not checked, make source and target matrices the same
  • Make a fake data table for DBSCAN that’s 5kx5x dimension, see if the three clusters can be found. Not too bad. 3k x3k should take about 90 seconds
  • Made NMF an option so that we can just cluster

Phil 1.5.17

7:00 – 8:00 Research

  • For charting, calculate distances and direction cosine from average center. Export that to excel. We’ll need a sampling interval.
  • Working on class FlockRecorder

8:30 – 4:00 BRC

  • Add weight widgets to JavaUtils2
  • Working on getting the clusters into the display – Done
  • Saving spreadsheets – Done!
  • Sorting rows in the map isn’t working right. Commented out for now

clusters

That’s a lot of datagrids

Phil 1.4.16

7:00 – 8:00 Research

  • For charting, calculate distances and direction cosine from average center. Export that to excel. We’ll need a sampling interval.
  • Adding class FlockRecorder

8:30 – BRC

  • Talked with Aaron about [R]. Generated spreadsheets with 2 nd 10 dimension clusters similar to what I’m testing on
  • Bring in R book tomorrow
  • Incorporating clustering into the GUI
    • Need to add EpsPercent – Done
    • Need to choose the matrix (raw, product, row factor, column factor
    • Also add clustering to the NMF calculation rather than taking the top 3
    • Start with output to the text console? Also to spreadsheet
    • Might build a map and populate a table
  • Need to submit forms for reimbursement and new class
  • Need to mail insurance – nope, need to erase more and print out mom’s will

5:00 Dinner at Jeff’s

Scan will and print out. Erase all pencil from blue form