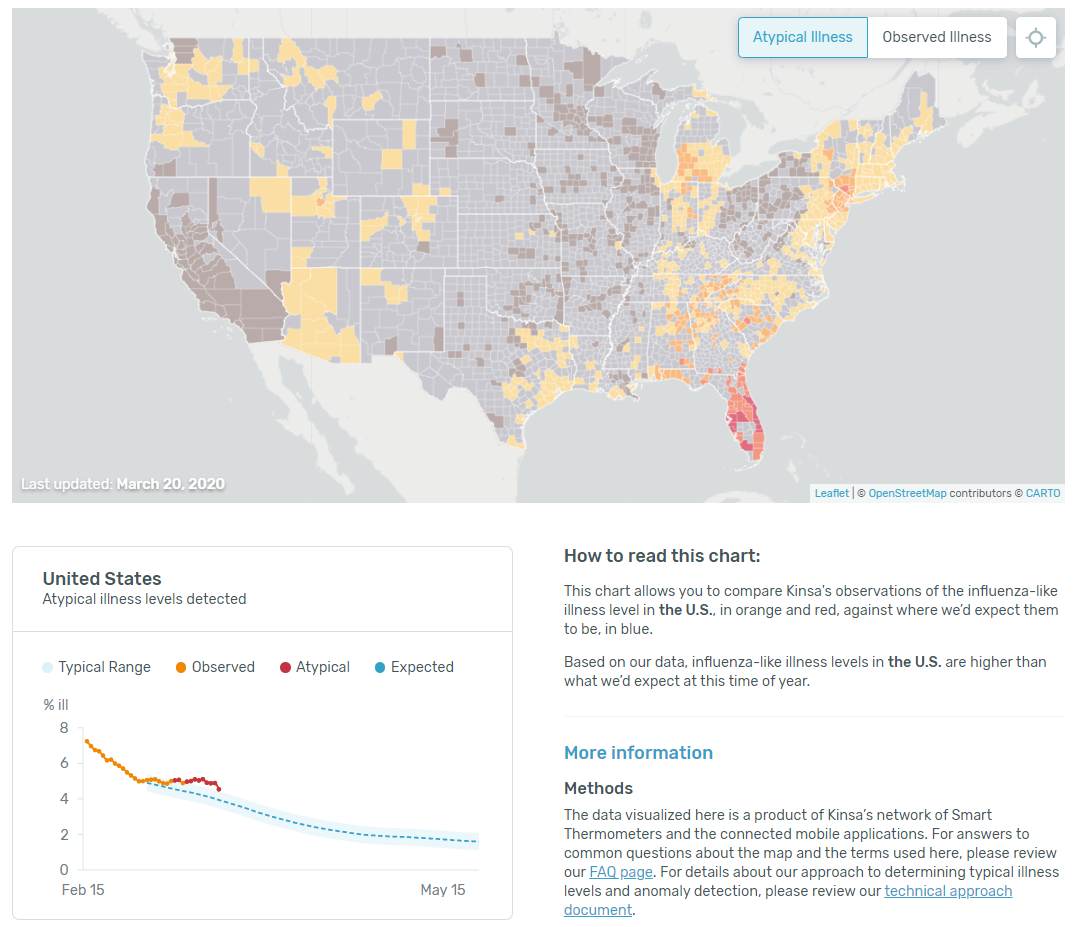
No analytics today, but I found this site: healthweather.us. It’s a project from Oregon State that uses data from IoT thermometers to look up anomalously high temperatures (the light gray is for no data):
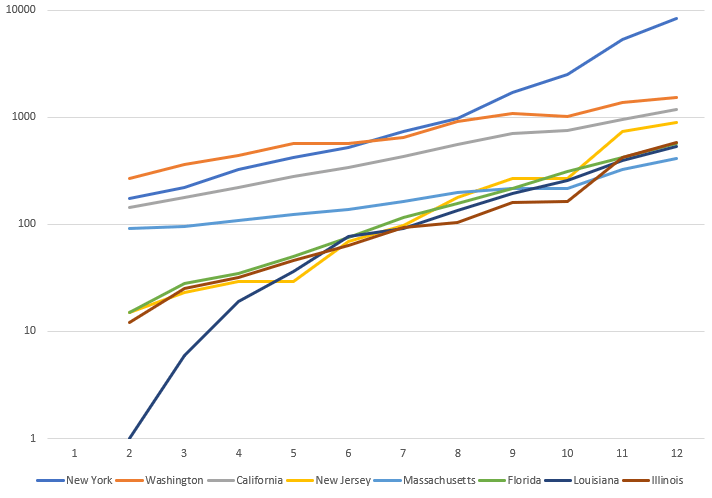
I’m not sure if these are statistically different rates of increase (more later), but Washington, Massachusetts, and California don’t seem to be increasing as fast as the other states? Florida, Louisiana, Illinois, and New Jersey are very much in the same population though. It’s looking at linear scales too. It is very clear that all these trends are really just getting started.
Lastly, here’s a good video that places COVID-19 on the context of other pandemics. I’m not convinced that it has all the numbers right, but it matches the numbers I do know:
Yesterday, I looked at the confirmed cases from this dataset. Today, I thought I’d look at the death rates. These are actually from yesterday. Maybe I’ll update at the end of the day. Everything is in a logarithmic scale because it’s impossible to tell the difference between one crazy exponential rate and another (It may be small-world power law as well, as per here). This is also with China excluded:
I mean, that’s not a good picture. I can see why California went on full non-essential lockdown today – we seem to be on the same trajectory as Iran, assuming the difference in slope is not related to manipulated or poorly-gathered information. South Korea, as per reports, really has appeared to adjust the trajectory. Note though, that the adjusted curve still seems to be exponential, but at a lower value.
My sense right now is that the economic impacts (however those would be charted) are going to look similar, with some kind of time delay that relates to spare capacity, like savings. My sense is that this is going to be bigger than the 2008 financial meltdown, but maybe in some kind of slow motion?
Since I can work from home, and work on government contracts, I’ve been sending money to food banks and similar charities. Hopefully, the best ways to contribute will become clear as the situation settles into the new “normal”. For some more thinking on the economic impact, there’s a short interview with John Ioannidis, who wrote in this article:
One of the bottom lines is that we don’t know how long social distancing measures and lockdowns can be maintained without major consequences to the economy, society, and mental health. Unpredictable evolutions may ensue, including financial crisis, unrest, civil strife, war, and a meltdown of the social fabric.
“A fiasco in the making? As the coronavirus pandemic takes hold, we are making decisions without reliable data” – StatNews, 3/17/2020
I tend to agree that the world at large is focusing on one, large immediate problem when it needs to be focusing on two large immediate problems. And that’s probably too much to expect.
We present a method that achieves state-of-the-art results for synthesizing novel views of complex scenes by optimizing an underlying continuous volumetric scene function using a sparse set of input views. Our algorithm represents a scene using a fully-connected (non-convolutional) deep network, whose input is a single continuous 5D coordinate (spatial location (x,y,z) and viewing direction (θ,ϕ)) and whose output is the volume density and view-dependent emitted radiance at that spatial location. We synthesize views by querying 5D coordinates along camera rays and use classic volume rendering techniques to project the output colors and densities into an image. Because volume rendering is naturally differentiable, the only input required to optimize our representation is a set of images with known camera poses. We describe how to effectively optimize neural radiance fields to render photorealistic novel views of scenes with complicated geometry and appearance, and demonstrate results that outperform prior work on neural rendering and view synthesis. View synthesis results are best viewed as videos, so we urge readers to view our supplementary video for convincing comparisons.
Let’s see if we can get InfluxDB working in Docker and start to generate and store data
I found a wonderful thing! It looks like you can change the default settings for where applications and their data are saved! Here’s a screenshot of where in the settings:
Going to verify that this is set for the admin accounts. It does!
I found the data sources for the dashboard in the previous few posts. Yes, everything still looks grim:
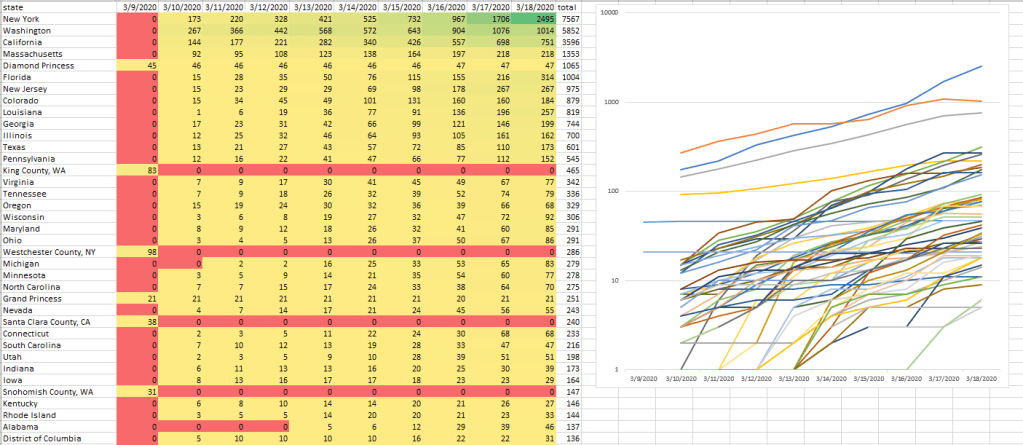
So rather than working on my dissertation, I thought I’d take a look at the data for the last 9(!) days in Excel:
This is for the USA. The data is sorted based on the cumulative total of new cases confirmed. If you look at the chart on the right, everything is in line with a pandemic in exponential growth. However, that’s not the whole story.
I like to color code the cells in my spreadsheets because colors help me visualize patterns in the data that I wouldn’t otherwise see. And one of the things that really stands out here is the red rows with one yellow cell on the left. These are all cases where the rate of confirmed new cases dropped to zero overnight. And they’re not near each other. They are in WA, NY, and CA. Is this a measuring problem or is something going right in these places?
Maybe we’ll find out more in the next few days. Now that I know how to get the data, I can do some of my own visualizations that look for outliers. I can also train up some sequence-to-sequence ML models to extrapolate trends.
One more thing. I had heard earlier (Twitter, I think?) that Vietnam was handling the crisis well. And it looks like it was, but things are back to being bad:
Ok, back to work
8:00 – 4:30 ASRC PhD, GOES
Working on the process section – done!
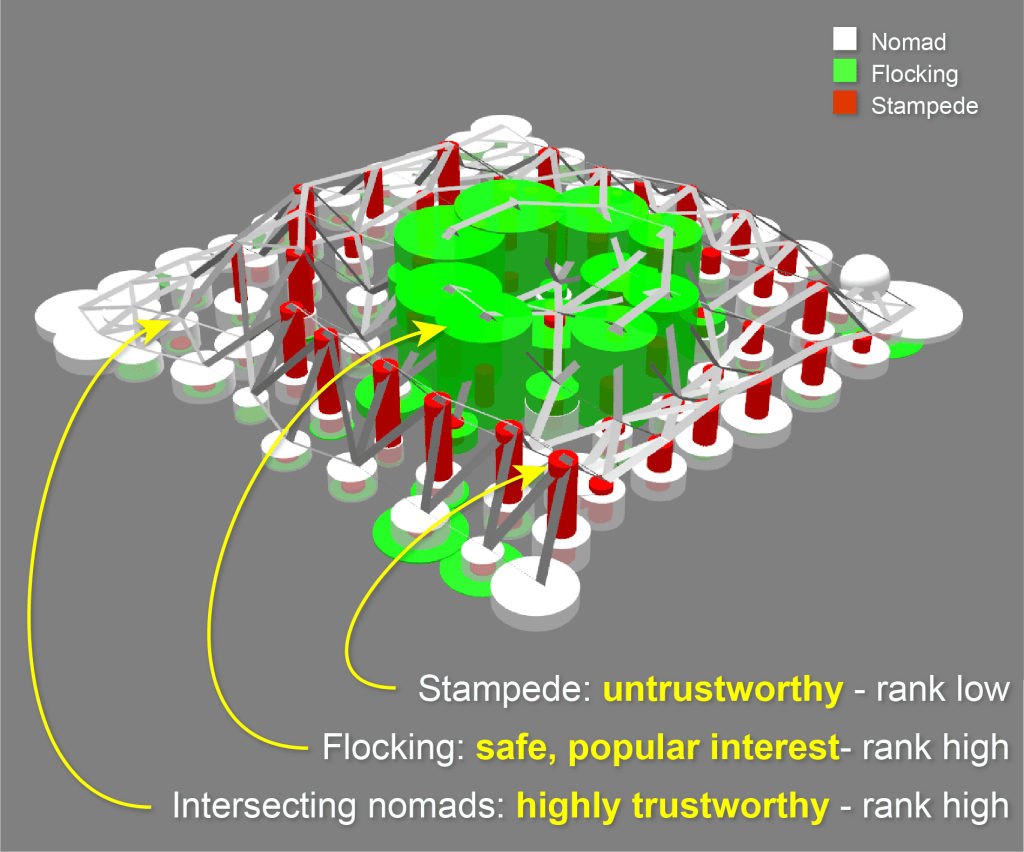
Working on the TACJ bookend – done! Made a new figure:
Submitted to Wayne. Here’s hoping it doesn’t fall through the cracks
Inattentional blindness is the psychological phenomenon that causes one to miss things in plain sight. It is a consequence of the selective attention in perception that lets us remain focused on important parts of our world without distraction from irrelevant details. Motivated by selective attention, we study the properties of artificial agents that perceive the world through the lens of a self-attention bottleneck. By constraining access to only a small fraction of the visual input, we show that their policies are directly interpretable in pixel space. We find neuroevolution ideal for training self-attention architectures for vision-based reinforcement learning tasks, allowing us to incorporate modules that can include discrete, non-differentiable operations which are useful for our agent. We argue that self-attention has similar properties as indirect encoding, in the sense that large implicit weight matrices are generated from a small number of key-query parameters, thus enabling our agent to solve challenging vision based tasks with at least 1000x fewer parameters than existing methods. Since our agent attends to only task-critical visual hints, they are able to generalize to environments where task irrelevant elements are modified while conventional methods fail.
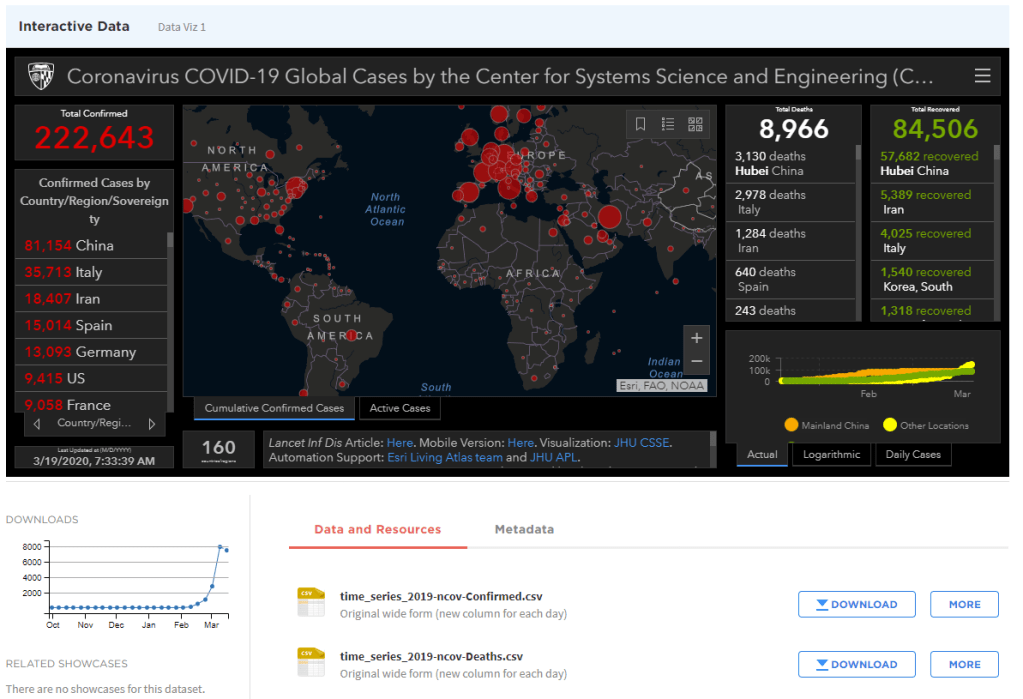
Today’s dashboard snapshot (more data here). My thoughts today are about supression and containment, which are laid out in the UK’s Imperial College COVID-19 report. The TL;DR is that suppression is the only strategy that doesn’t overwhelm healthcare. Suppression is fever clinics, contact tracing, and enforced isolation, away from all others (in China, this was special isolation clinics/dorms). This has clearly worked in China (and a town in Italy), though Hong Kong and Singapore seem to be succeeding in different (more cultural?) ways. The thing that strikes me is that suppression is just putting a lid on things. The moment the lid comes off, then infections start up again? I guess we’ll see over the next few months in China.
There appear to be vaccines in (human already!) testing. Normally, there is an extensive evaluation process to see if the treatment is dangerous, but that was sidestepped during the AIDS crisis (the parallel track policy). I wonder if at risk populations (People older than 70?), will allowed to use less-tested drugs. My guess is yes, probably within a month.
Finished all the dissertation revisions and made a document that contains only those revisions. Need to make a change tableand then send (full and revisions only) to Wayne today.
Whoops! No I didn’t. After putting together the change table, I realize there are still a few things to do. Dammit!
Update SDaaS paper as per John’s edits
Phone call with Darren at 2:00
Start a google doc that has all the parts of a proposal, plus a good introduction.
Also the idea of sims came up again as ways to define, explain, train ML, and test a problem/solutions
Today’s view of the dashboard. Looking at the numbers, it’s pretty clear that China has things under control, which means that we can get an idea of what it will look like in the US on the other side. The symptomatic population was (3,111 deaths + 55,987 recovered) = 59,098. That means that the mortality rate for that (infected? symptomatic?) population (59,098/3,111) is 5.26%. The median age in China is 38.4 years. Interestingly, that’s about the same as the USA.
Working from home for the duration of the COVID-19 pandemic. It’s estimated that we are approximately 10 days behind Italy, So I’m hoping that when things start to get better there, it will be a head’s up that things might start to get better here.
Needless to say, things are not getting better there yet.
So, before the university gets to the point where it can’t handle the submission of the dissertation, I’m going to work on getting the revisions done and submitted.
Finished first pass through Limitations and Research chapter
Tried to start on fixing the conclusions but ran out of motivation
#COVID-10 meeting at noon –
Set up folders for lit, assets, software and data
Started a rough draft of the (chi 2021?) paper
Write BSO about moving Mahler to Bach/Radiohead – done
Started to work through the SDaaS paper with John D.
Modeling immensely complex natural phenomena such as how subatomic particles interact or how atmospheric haze affects climate can take many hours on even the fastest supercomputers. Emulators, algorithms that quickly approximate these detailed simulations, offer a shortcut. Now, work posted online shows how artificial intelligence (AI) can easily produce accurate emulators that can accelerate simulations across all of science by billions of times.
Working on revisions – Finished the limitations and research agenda chapter body! Now I need to add the overview and the summary. Then on to the revisit of my hut.
Spent the last few days at GSAW 2020. Got to present a paper/extended abstract, and learned a lot about the ground station community. For example, I learned that The Aerospace Corporation was a Thing. Also participated in a panel on machine learning and got to tell the autonomous vehicles in a fire story. The audience paid attention! Basically, I pitched Charles Perrow a lot.
AirSim is a simulator for drones, cars and more, built on Unreal Engine (we now also have an experimental Unity release). It is open-source, cross platform, and supports hardware-in-loop with popular flight controllers such as PX4 for physically and visually realistic simulations. It is developed as an Unreal plugin that can simply be dropped into any Unreal environment. Similarly, we have an experimental release for a Unity plugin.
Added notes for the dissertation revisions
Working on the GVSETS paper – meeting at 3:00. Got everything into SVN and coordinated across machines.
Combine the Limitations and Future Work chapters into a new chapter that explores where my research has landed. I think that a beachhead analogy might work here.
Preliminary, early work that lives in the space between computational sociology and HCC (socio-technical, from From Keyword Search to Exploration). Add discussions about wormholes, weathermaps, and maps that connect distant places, like air travel maps.
Diversity science
Gathering data on online consensus in various sized groups and within different cultures
Extending simulations into human belief spaces, such as with GPT-2 agents
Add a “my hut, revisited” section to the contributions that discusses the contributions from the perspective of the spaces defined by Kauffman, Martindale, and Bacharach in particular, but also the literature in general
Tie into this as well
Some general reworking of the contributions text to reflect the slides: This also requires expansion of the current text in CH11. In particular slides 49-52 are a stronger synopsis than is provided in your CH10 discussion. Slides 53-56 are a more thoughtful framing of your contributions, both theoretical and practical (can you weave this back in your literature from CH2 to show specific knowledge contribution?). The “bookend” revisiting ofthe trustworthy anonymous citizen journalism was also more effective in the presentation than the document. Consider capturing this.








 viztales
You must be logged in to post a comment.