
Not at all happy with this COVID weight gain. My preferred stress management tool is exercise, but I’m at a minimum of 20 miles/day. Usually about 100 miles+ on weekends.
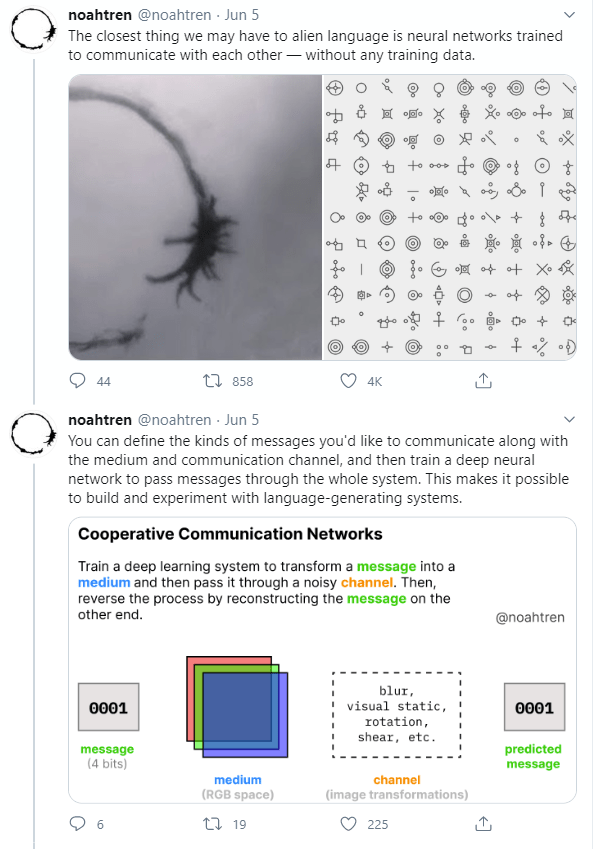
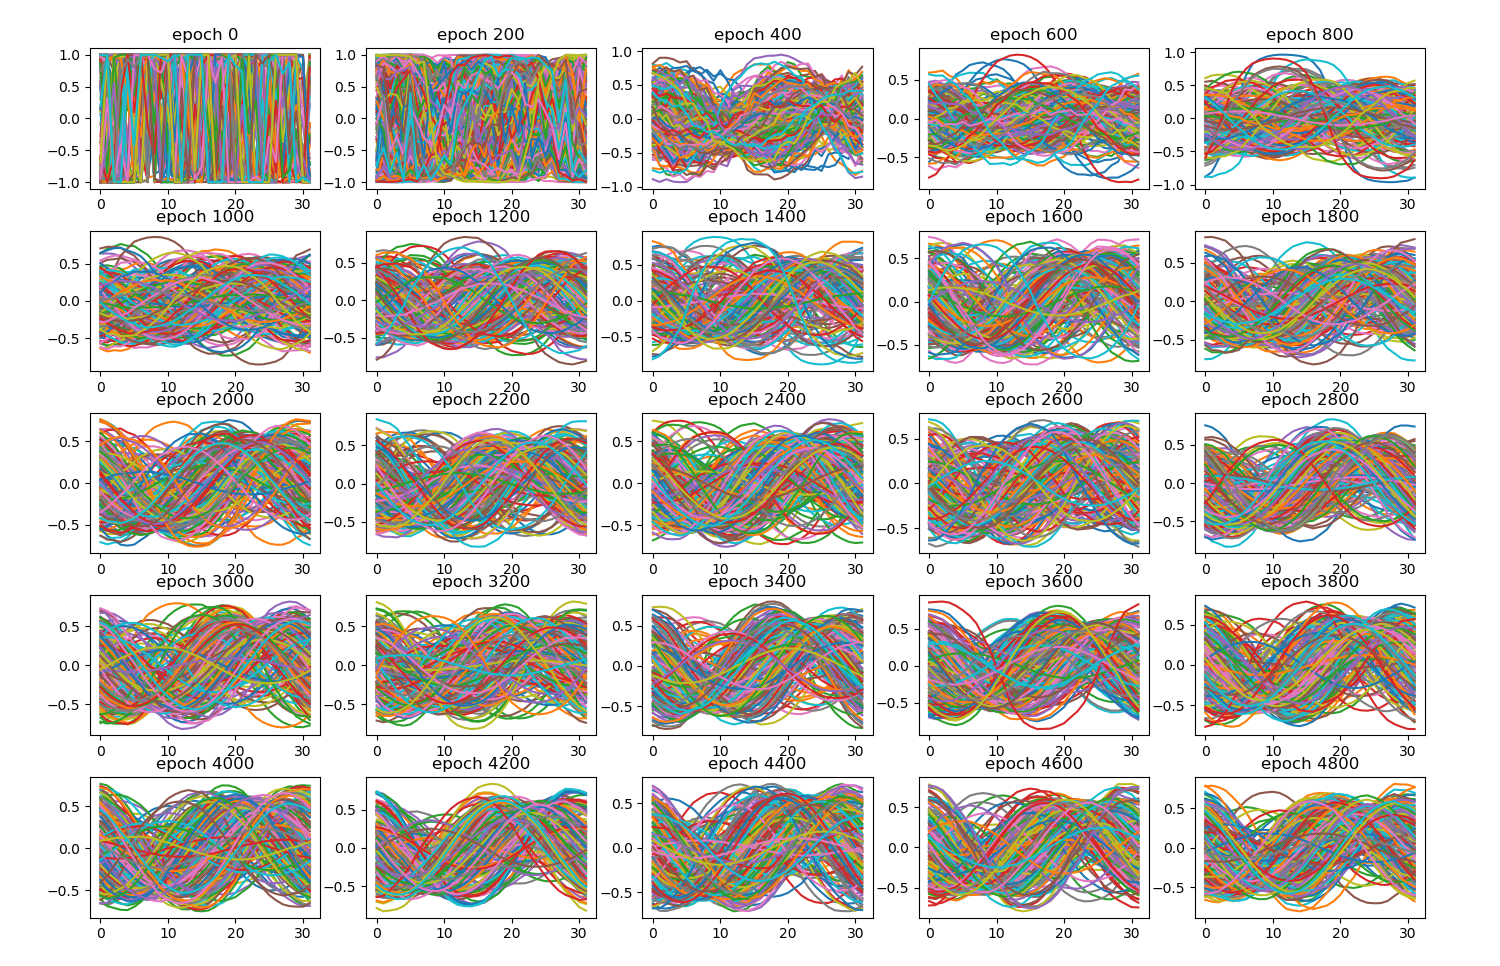
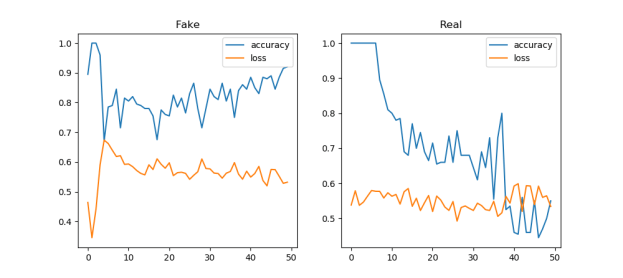
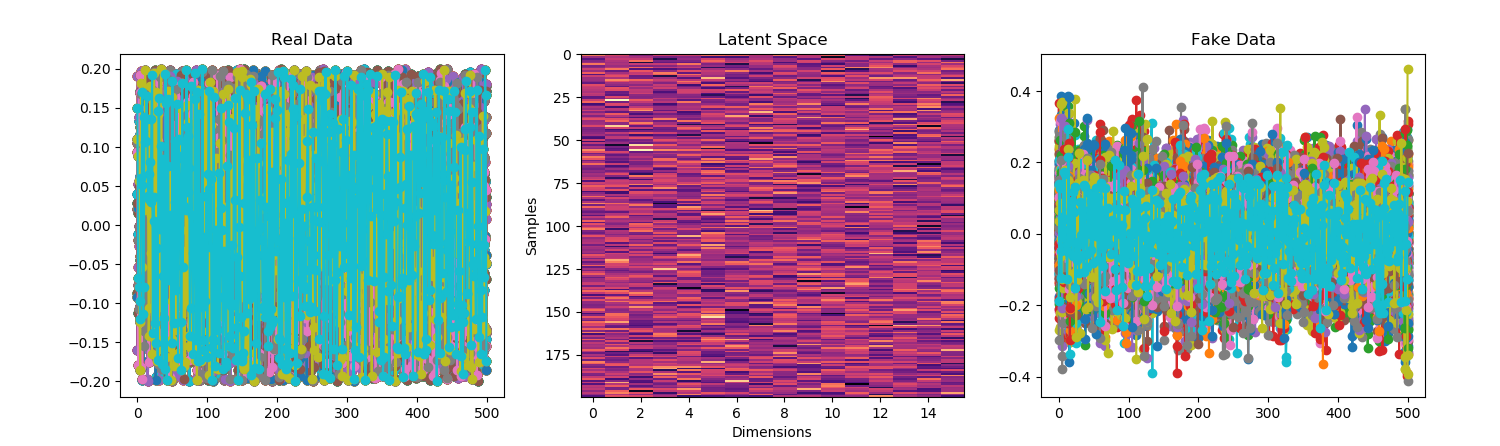
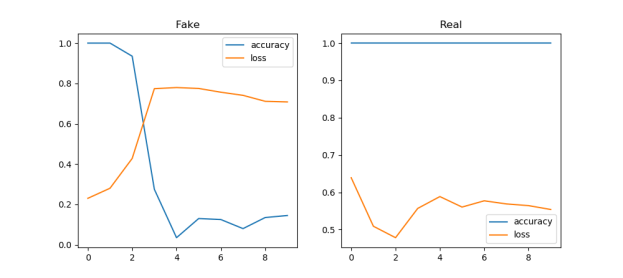
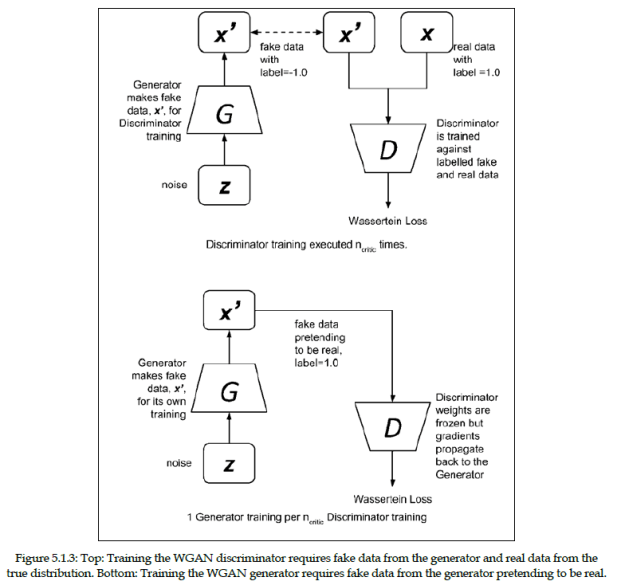
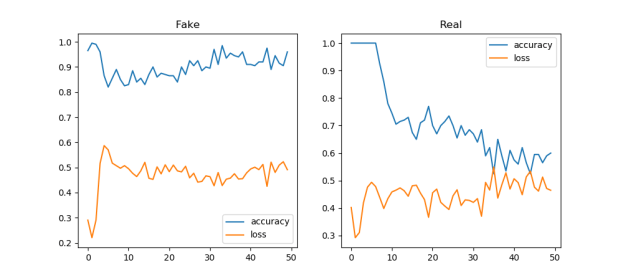
Starting to think about writing something on the ethics of mode collapse
D20
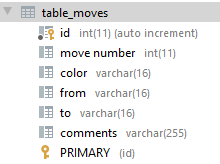
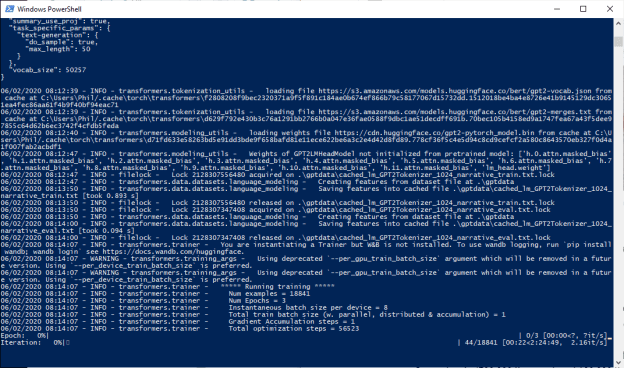
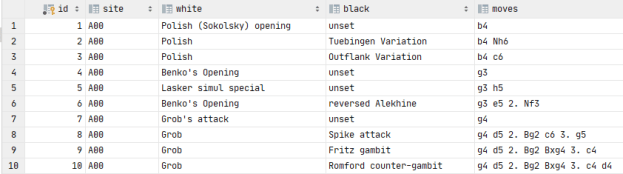
GPT-2 Agents
- Back to pulling move and piece information out of generated text – done
- Added heuristic for move number
- Created dicts for db data. Add writes tomorrow!
GOES
- Adding read tests – done! Had to screw around with utc conversions for a while
- Writes are roughly 1/2 sec per 1,000
- Reads are about 2/100 sec per 1,000
- Tried to log in and get on the devlab influx system – nope:

- Trying to figure out what makes sense to do next. Ping Vadim? Done
 All the writes are working. I’ll do the reads Monday. Everything looks pretty consistent, though.


You must be logged in to post a comment.