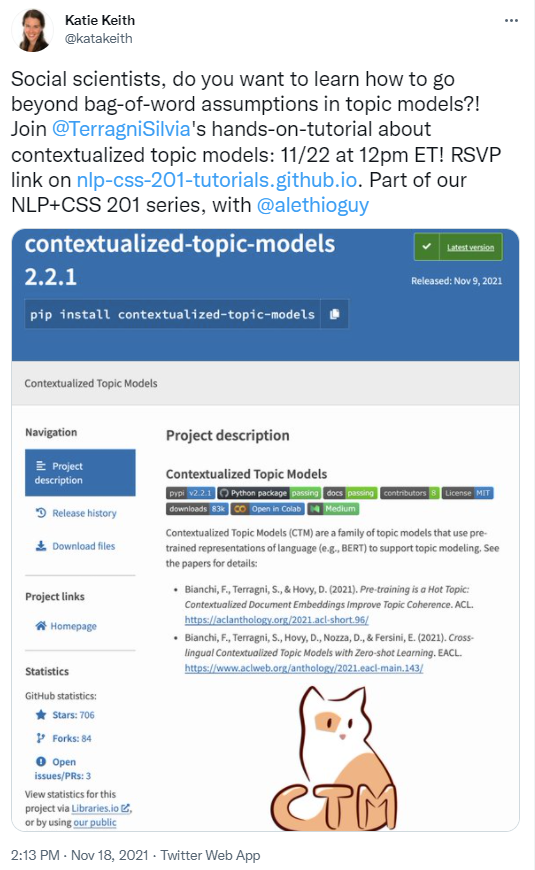
This website hosts the upcoming tutorial series for advanced NLP methods, for computational social science scholars.
Every few weeks, we will host some experts in the field of computational social science to present a new method in NLP, and to lead participants in an interactive exploration of the method with code and sample text data. If you are a graduate student or researcher who has some introductory knowledge of NLP (e.g. has learned text analysis from SICSS) and wants to “level up”, come join us!
Playing around with the conspiracy theory map since I know that area and it needs another pass
I have a thought about counting new results from the gpt. When there is a response from the gpt, there should be a button(?) that counts and deletes all substrings in the return that matches a topic in a node, with the appropriate connections between topics and nodes. I’ll need to add a count value to table_topic. It can have a default of 1
Worked most of the weekend. I have a first pass on the methods and results section, some notes on discussion, and still need to start the conclusions. Also, fold the text into the white paper – DONE!
Working on the final report, which is due MONDAY (Nov 5), rather than Thursday (Nov 18). When did I find this out? Thursday, Nov 11, which gives me 2-ish days to write the whole report rather than 5-ish. Unless we use the weekend. Sigh. At least the weather is crappy.
Armistice Day is commemorated every year on 11 November to mark the armistice signed between the Allies of World War I and Germany at Compiègne, France, at 5:45 am for the cessation of hostilities on the Western Front of World War I, which took effect at eleven in the morning—the “eleventh hour of the eleventh day of the eleventh month” of 1918.Wikipedia
Online debates are often characterised by extreme polarisation and heated discussions among users. The presence of hate speech online is becoming increasingly problematic, making necessary the development of appropriate countermeasures. In this work, we perform hate speech detection on a corpus of more than one million comments on YouTube videos through a machine learning model, trained and fine-tuned on a large set of hand-annotated data. Our analysis shows that there is no evidence of the presence of “pure haters”, meant as active users posting exclusively hateful comments. Moreover, coherently with the echo chamber hypothesis, we find that users skewed towards one of the two categories of video channels (questionable, reliable) are more prone to use inappropriate, violent, or hateful language within their opponents’ community. Interestingly, users loyal to reliable sources use on average a more toxic language than their counterpart. Finally, we find that the overall toxicity of the discussion increases with its length, measured both in terms of the number of comments and time. Our results show that, coherently with Godwin’s law, online debates tend to degenerate towards increasingly toxic exchanges of views.
GPT Agents
Sent data off to Shimei to run through LIWC
Good meeting yesterday
Start writing some outline text
SBIRs
Write!
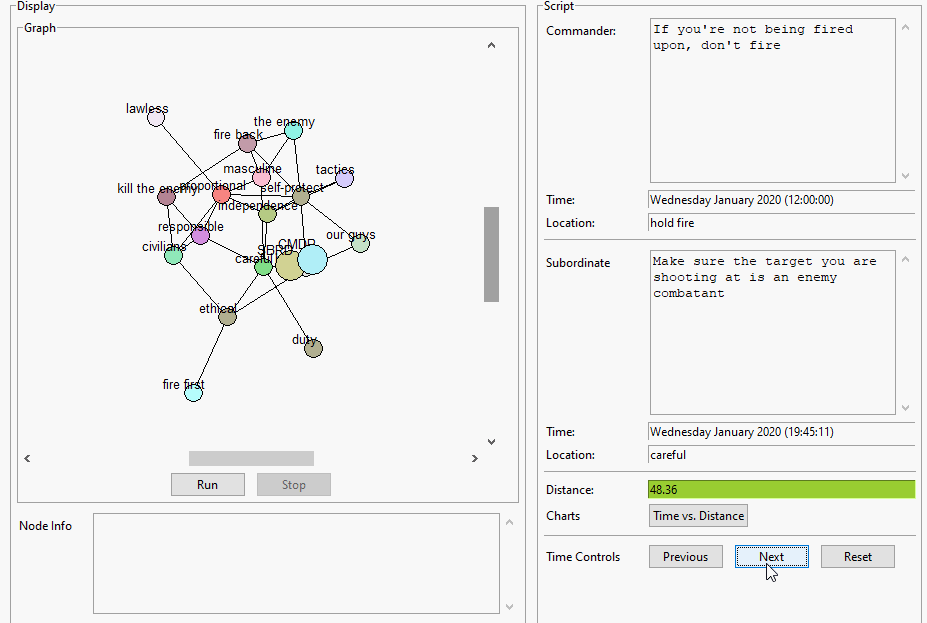
Try running the script text through the text matcher to see which nodes it goes to. That can be used in the results section. Also add a “recalculate” button to the text compare popup?
I remember years ago, it must have been some time in the ’90’s, seeing billboards for ISPs on the 101 heading from SFX to San Francisco. This feels like that:
Nowadays, many of our actions are transformed into digital information, which we can use to draw diagrams that describe complex operations, such as those of institutions. This book introduces us to the reading of complex systems through the concept of affinity: the alchemy that brings people together and makes them creative and productive.
Affinity’s mapping is a data visualization method that allows us to observe the dynamics of an organization subdivided into complex systems: institutions, universities, governments, etc. It is a graphical tool based on the collaboration variable. Mapping Affinities is, according to the author, an instrument for deciphering complex organizations and improving them. By inserting individuals on these maps, it is also a way of helping them to understand how to evolve in life within an institution. The book tackles this problem with a case study concerning the Federal Polytechnic School of Lausanne. Data from the actions of researchers at the Lausanne institution are brought together and transformed into an innovative and attractive map
Stored as an epub in gdrive Books
GPT Agents
Generate spreadsheets from single stars – done
Add KL-divergence and Total Variation Distance to analysis.
Created query for ground truth by vegetarian options by stars and saved to spreadsheets
I need to normalize everything, then then compare the normalized versions in a new spreadsheet. Don’t forget the offset and scalar! (x*scalar + offset)
SBIR(s)
Stories for next sprint – done
Book
See what else needs to be done for the Oxford proposal and send it off by the end of the week?
Run each through the “vegetarian” options. I’m really curious how LIWC will look at the outputs of the models with relation to each other, and to the ground truth. Also get the counts of the occurrences of each prompt in the GT by star rating. My guess is that it won’t show up in some of the cases, which sets up the Twitter section really well.
4:15 Meeting
SBIRs
Fix duplicate entries in the DB topic file – done
Back up db – done
Create superclass that has most of the parts and then subclass the various implementations (Full, BuildView, ViewScript) – done
Work with Aaron on the stories/maps? Also, what is our plan for the paper? In process
WordPress has some serious lag. Need to back this up
GPT Agents
Delayed meeting until Friday. That should give me time to get the balanced data working and compare baseline models to the baseline data (American)
And the balanced data still isn’t working. I think that there are more paths to good reviews, so the GPT, even when fed balanced data generates unbalanced results. Training up single star models to verify this
Also, write a first pass on the introduction that uses the vegetarian Yelp as an example, and then set up to explain the method
Do I still need to train x-star models?
SBIRs
9:15 Standup
11:00 LAIC
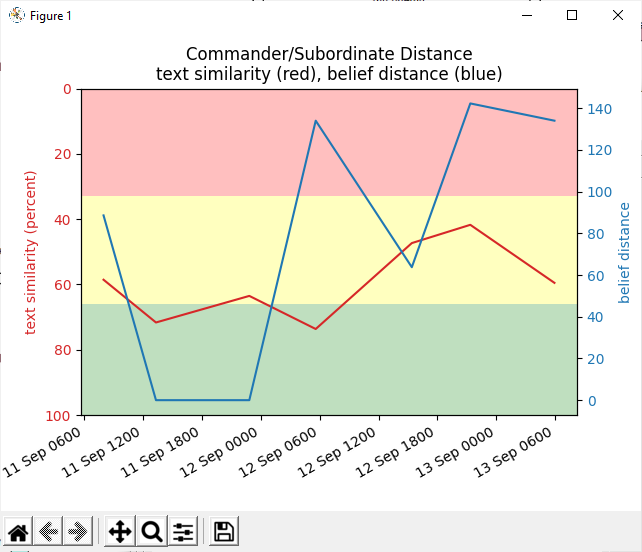
Get the script running for the current map to show at the meeting today – done!
…clearly Biden was a net drag on McAuliffe. Overall, Virginians disapproved of Biden’s handling of the presidency by a 10-point margin, with nearly half saying they “strongly disapprove” — double the percentage who strongly approved. Nearly 3 in 10 Virginia voters said their vote was meant to express opposition to Biden, network exit polls found, compared to the 2 in 10 who said their vote was to express support for Biden. The economy was by far the most important issue driving Virginia voters, and people who put the economy at the top of their list favored Youngkin by a dozen percentage points. (Washington Post)
I just found this: https://github.com/google-research/tiny-differentiable-simulator It appears to be a NN-enhanced physics sim: “TDS can run thousands of simulations in parallel on a single RTX 2080 CUDA GPU at 50 frames per second:“ Here are the relevant papers:
“NeuralSim: Augmenting Differentiable Simulators with Neural Networks”, Eric Heiden, David Millard, Erwin Coumans, Yizhou Sheng, Gaurav S. Sukhatme. PDF on Arxiv
“Augmenting Differentiable Simulators with Neural Networks to Close the Sim2Real Gap”, RSS 2020 sim-to-real workshop, Eric Heiden, David Millard, Erwin Coumans, Gaurav Sukhatme. PDF on Arxiv and video
“Interactive Differentiable Simulation”, 2020, Eric Heiden, David Millard, Hejia Zhang, Gaurav S. Sukhatme. PDF on Arxiv
Finished training the balanced model and am re-running the original prompts
A really negative prompt will produce a low review distribution. Here’s an example of GPT generating reviews in response to a slightly negative set of prompts ([there are absolutely no vegetarian options], [there is not a single vegetarian option on the menu], [the menu has no vegetarian options]), compared with the ground truth of the Yelp database returning reviews and ratings that match the string ‘%no vegetarian options%‘:
Average star ratings
The distribution of star ratings is obviously different too:
As you can see on the right, the ground truth is distinctly different. The correlation coefficient between the two distributions on the right is -0.4, while it’s well above 0.9 when comparing any of the three distributions to the left.
So it’s clear that the model has a bias towards positive reviews. In fact, if you look at the baseline distribution from the first 1,000 reviews of restaurants in the ‘American’ category, we can see the underlying distribution that the model was trained on:
Star bias in the data
The new question to answer is what happens to the responses when the training data is balanced for stars? Also, I realize that I need to run a pass through the models with just a ‘review:‘ prompt.
Dammit, the ‘balanced’ training corpora isn’t. Need to fix that and re-train
Bad data
4:15 Meeting
SBIRs
MDA costing meeting
Work on building first pass map. It’s actually working pretty well! Need to write an example script for tomorrow
Create balanced (20k each) star corpora and train – done
Create low star corpora and train (1, 2, 3?)
Installed sentence-transformers, which probably broke sentiment.
SBIRs
Integrate TextComparePopup and try making a map. I’m pretty sure that there will be issues about putting topics into groups and listing topics from different groups – done, and seems to be working well. Tomorrow we try for real?
Spreadsheets for vegetarian 100k GT vs GT vs synth. Everything is good except for ‘no vegetarian options’ It’s the only options that does not appear in the first 100k rows. Going to try some longer prompts to see if I can nudge the model in a better direction. Do that at lunch
Hmmm. I can’t seem to produce a negative star distribution:


You must be logged in to post a comment.