Category Archives: Python

Phil 4.20.20

GOES

  • Reading the Distill article on Gaussian processes (highlighted page here)
  • Copy over neural-tangents code from notebook to IDE
  • Working on regression
  • Ran into a problem with Tensorboard
    Traceback (most recent call last):
      File "d:\program files\python37\lib\runpy.py", line 193, in _run_module_as_main
        "__main__", mod_spec)
      File "d:\program files\python37\lib\runpy.py", line 85, in _run_code
        exec(code, run_globals)
      File "D:\Program Files\Python37\Scripts\tensorboard.exe\__main__.py", line 7, in 
      File "d:\program files\python37\lib\site-packages\tensorboard\main.py", line 75, in run_main
        app.run(tensorboard.main, flags_parser=tensorboard.configure)
      File "d:\program files\python37\lib\site-packages\absl\app.py", line 299, in run
        _run_main(main, args)
      File "d:\program files\python37\lib\site-packages\absl\app.py", line 250, in _run_main
        sys.exit(main(argv))
      File "d:\program files\python37\lib\site-packages\tensorboard\program.py", line 289, in main
        return runner(self.flags) or 0
      File "d:\program files\python37\lib\site-packages\tensorboard\program.py", line 305, in _run_serve_subcommand
        server = self._make_server()
      File "d:\program files\python37\lib\site-packages\tensorboard\program.py", line 409, in _make_server
        self.flags, self.plugin_loaders, self.assets_zip_provider
      File "d:\program files\python37\lib\site-packages\tensorboard\backend\application.py", line 183, in standard_tensorboard_wsgi
        flags, plugin_loaders, data_provider, assets_zip_provider, multiplexer
      File "d:\program files\python37\lib\site-packages\tensorboard\backend\application.py", line 272, in TensorBoardWSGIApp
        tbplugins, flags.path_prefix, data_provider, experimental_plugins
      File "d:\program files\python37\lib\site-packages\tensorboard\backend\application.py", line 345, in __init__
        "Duplicate plugins for name %s" % plugin.plugin_name
    ValueError: Duplicate plugins for name projector
  • After poking around a bit online with the “Duplicate plugins for name %s” % plugin.plugin_name ValueError: Duplicate plugins for name projector, I found this diagnostic, which basically asked me to reinstall everything*. That didn’t work, so I went into the Python37\Lib\site-packages and deleted by hand. Tensorboard now runs, but now I need to upgrade my cuda so that I have cudart64_101.dll
    • Installed the minimum set of items from the Nvidia Package Launcher (cuda_10.1.105_418.96_win10.exe)
    • Installed the cuDNN drivers from here: https://developer.nvidia.com/rdp/cudnn-download
    • The regular (e.g. MNIST) demos work byt when I try the distribution code I got this error: tensorflow.python.framework.errors_impl.InvalidArgumentError: No OpKernel was registered to support Op ‘NcclAllReduce’. It turns out that there are only two viable MirroredStrategy operations, for windows, and the default is not one of them. These are the valid calls:
      distribution = tf.distribute.MirroredStrategy(cross_device_ops=tf.distribute.ReductionToOneDevice())
      distribution = tf.distribute.MirroredStrategy(cross_device_ops=tf.distribute.HierarchicalCopyAllReduce())
    • And this call is not
      # distribution = tf.distribute.MirroredStrategy(cross_device_ops=tf.distribute.NcclAllReduce()) # <-- not valid for Windows
  • Funny thing. After reinstalling and getting everything to work, I tried the diagnostic again. It seems it always says to reinstall everything
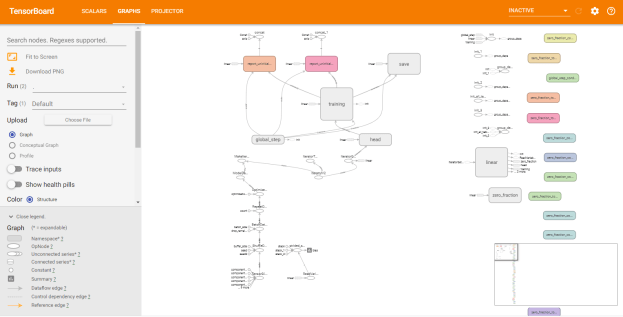
  • And Tensorboard is working! Here’s the call that puts data in the directory:
    linear_est = tf.estimator.LinearRegressor(feature_columns=feature_columns, model_dir = 'logs/boston/')
  • And when launched on the command line pointing at the same directory:
    D:\Development\Tutorials\Deep Learning with TensorFlow 2 and Keras\Chapter 3>tensorboard --logdir=.\logs\boston
    2020-04-20 11:36:42.999208: I tensorflow/stream_executor/platform/default/dso_loader.cc:44] Successfully opened dynamic library cudart64_101.dll
    W0420 11:36:46.005735 18544 plugin_event_accumulator.py:300] Found more than one graph event per run, or there was a metagraph containing a graph_def, as well as one or more graph events.  Overwriting the graph with the newest event.
    W0420 11:36:46.006743 18544 plugin_event_accumulator.py:312] Found more than one metagraph event per run. Overwriting the metagraph with the newest event.
    Serving TensorBoard on localhost; to expose to the network, use a proxy or pass --bind_all
    TensorBoard 2.1.1 at http://localhost:6006/ (Press CTRL+C to quit)
  • I got this! tensoboard
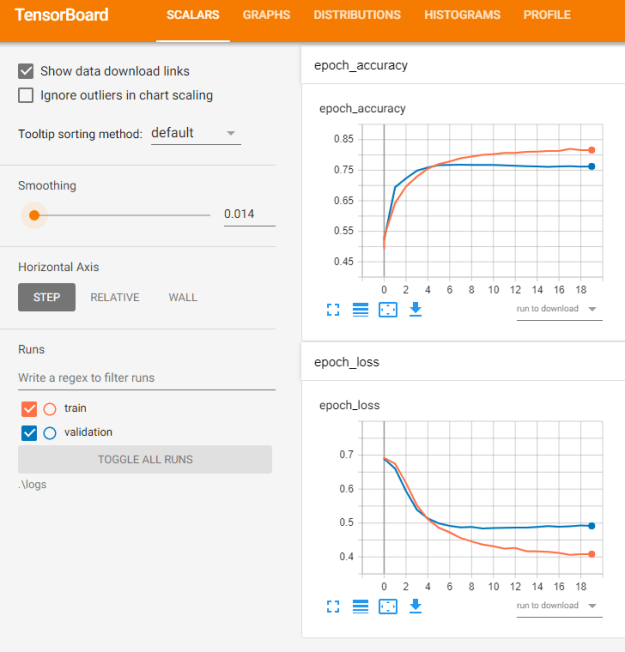
  • Of course, we’re not done yet. When attempting to use the Keras callback, I get the following error: tensorflow.python.eager.profiler.ProfilerNotRunningError: Cannot stop profiling. No profiler is running. It turns out that you have to specify the log folder like this
      • command line:
        tensorboard --logdir=.\logs
      • in code:
        logpath = '.\\logs'


  • That seems to be working! RunningTBNN
  • Finished regression chapter

ASRC

  • Submitted RFI response for review

ACSOS

  • Got Antonio’s comments back

D20

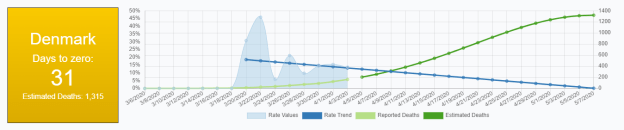
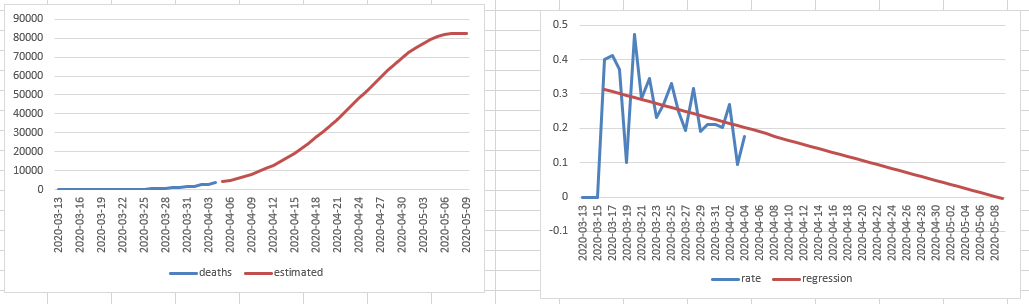
  • Need to work on the math to find second bumps
    • If the rate has been < x% (maybe 2.5%), calculate an offset that leaves a value of 100 for each day. When the rate jumps more than y% (e.g. 100 – 120 = 20%), freeze that number until the rate settles down again and repeat the process
    • Change the number of samples to be the last x days
  • Work with Zach to get maps up?

ML seminar

Phil 4.18.20

Cross-Platform State Propaganda: Russian Trolls on Twitter and YouTube during the 2016 U.S. Presidential Election

  • This paper investigates online propaganda strategies of the Internet Research Agency (IRA)—Russian “trolls”—during the 2016 U.S. presidential election. We assess claims that the IRA sought either to (1) support Donald Trump or (2) sow discord among the U.S. public by analyzing hyperlinks contained in 108,781 IRA tweets. Our results show that although IRA accounts promoted links to both sides of the ideological spectrum, “conservative” trolls were more active than “liberal” ones. The IRA also shared content across social media platforms, particularly YouTube—the second-most linked destination among IRA tweets. Although overall news content shared by trolls leaned moderate to conservative, we find troll accounts on both sides of the ideological spectrum, and these accounts maintain their political alignment. Links to YouTube videos were decidedly conservative, however. While mixed, this evidence is consistent with the IRA’s supporting the Republican campaign, but the IRA’s strategy was multifaceted, with an ideological division of labor among accounts. We contextualize these results as consistent with a pre-propaganda strategy. This work demonstrates the need to view political communication in the context of the broader media ecology, as governments exploit the interconnected information ecosystem to pursue covert propaganda strategies

JAX Paper

D20

  • Get centroids working – done!
    • Fixed names
    • For each country
  • Work on a “score” that looks at countries with larger(?) populations’s projections where the days to zero is less than 15. Do a distribution and then score

ML Seminar

  • Started to look at the neural tangents library.
  • Installed
  • Did a first pass through the Colab notebook. Need to but this in my IDE

Phil 4.16.20

Fix siding!

SageMathMore on SageTex here

D20

  • Playing around with something to indicate the linear fit to the data. Trying P value
  • Updated UI code so that the P value will display on the next build
  • Hopefully we try the world map code today?

GOES

IMDB_embedding

  • Learning more about multiple inputs to embedding and had to get the keras.utils.plot_model working, which failed with this error: ImportError: Failed to import pydot. You must install pydot and graphviz for `pydotprint` to work. So I pip installed both, and had the same problem.
  • Had problems running the distribution samples. Upgraded tf to version 2.1. No problems and better performance
  • Finished chapter 2

ACSOS

  • Struggled with picture placement. Moving on.
  • Finished first pass. I need to add more ABM text, but I’m down to 10 pages plus references!

Multi-input and multi-output models

  • Here’s a good use case for the functional API: models with multiple inputs and outputs. The functional API makes it easy to manipulate a large number of intertwined datastreams. Let’s consider the following model. We seek to predict how many retweets and likes a news headline will receive on Twitter. The main input to the model will be the headline itself, as a sequence of words, but to spice things up, our model will also have an auxiliary input, receiving extra data such as the time of day when the headline was posted, etc. The model will also be supervised via two loss functions. Using the main loss function earlier in a model is a good regularization mechanism for deep models.


Phil 4.15.20

Fix siding from wind!

D20

  • Talked to Aaron about taking a derivative of the regression slope to see what it looks like. There may be common features in the pattern of rates, or of the slopes of the regressions changing over time
  • Still worried about countries that don’t report well. I’d like to be able to use rates from neighboring countries as some kind of check
  • Got the first pass on a world map json file done
  • Spread of SARS-CoV-2 in the Icelandic Population
    • As of April 4, a total of 1221 of 9199 persons (13.3%) who were recruited for targeted testing had positive results for infection with SARS-CoV-2. Of those tested in the general population, 87 (0.8%) in the open-invitation screening and 13 (0.6%) in the random-population screening tested positive for the virus. In total, 6% of the population was screened. Most persons in the targeted-testing group who received positive tests early in the study had recently traveled internationally, in contrast to those who tested positive later in the study. Children under 10 years of age were less likely to receive a positive result than were persons 10 years of age or older, with percentages of 6.7% and 13.7%, respectively, for targeted testing; in the population screening, no child under 10 years of age had a positive result, as compared with 0.8% of those 10 years of age or older. Fewer females than males received positive results both in targeted testing (11.0% vs. 16.7%) and in population screening (0.6% vs. 0.9%). The haplotypes of the sequenced SARS-CoV-2 viruses were diverse and changed over time. The percentage of infected participants that was determined through population screening remained stable for the 20-day duration of screening.

ACSOS

  • Finished first pass of the lit review. Now at 13 pages

GOES

  • Start looking at GANs. Also work on fixing Optevolver for multiple CPUs
    • Starting Deep Learning with TensorFlow 2 and Keras: Regression, ConvNets, GANs, RNNs, NLP, and more with TensorFlow 2 and the Keras API, 2nd Edition. Chapter six is GANs, which is what I’m interested in, but I’m ok with getting some review in first.
    • Working on embeddings with the IMDB sentiment analysis project. It’s the first time I’ve seen an embedding layer which is 1) Cool, and 2) Something to play with. I’d noticed when I was working with Word2Vec for my research that embeddings didn’t seem to change shape much as a function of the number of dimensions. It seemed like a lot of information was being kept at very low dimensions, like three, rather than the more accepted 128 or so:

place-embeddings

    • Well, this example gave me an opportunity to test that with some accuracy numbers. Here’s what I get:

EmbeddingDimensions

    • That is super interesting. It basically means that model building, testing, and visualization can happen at low dimensions. That makes everything faster, and with about a 10% improvement likely as one of the last steps.
    • Continuing with book.
  • Wrote up a response to Mike M’s questions about the white paper. Probably pointless, and has pretty much wasted my afternoon. And it was pointless! Now what?
  • Slides for John?

Phil 4.14.20

Fix siding from wind!

D20

  • I want to try taking a second derivative of the rates to see what it looks like. There may be common features in the pattern of rates, or of the slopes of the regressions changing over time
  • I’m also getting worried about countries that don’t report well. I’d like to be able to use rates from neighboring countries as some kind of check
  • Work with Zach on cleanup and map integration?

COVID Twitter

  • Finished ingesting the new data. It took almost 24 hours

ACSOS

  • Finished first pass of the introduction. Still at 14 pages

GOES

Phil 4.13.20

That was a very solitary weekend. I fixed some bikes, planted some herbs and vegetables, cleaned house, and procrastinated about pretty much everything else. I pinged Don and Wayne about D20 ideas, and got a ping for more info from Don, then silence. Everyone seems to be wrapped up tight in their worlds.

And for good reason. Maryland is looking grim:

Maryland_4_13_2020

D20

  • Worked with Zach to get states in. It’s working!

D20USA

COVID Twitter

  • Went looking for new data to ingest, but didn’t see anything new? It wasn’t there yet. Ingesting now
  • 1:30 Meeting

ACSOS

  • Reading through paper and pulling out all the parts from Simple Trick
  • Ping Antonio to let him know I’m working

GOES

  • Get absolute queries working in InfluxDB2. It took some looking, but here’s an example from the API reference on range(). Done!
    • Everything is in GMT. As usual, the parser is picky about the format, which is ISO-8601:
      range_args = "start:2020-04-13T13:30:00Z, stop:2020-04-13T13:30:10Z"
  • Start on TF2/GANs for converting square waves to noisy sin waves of varying frequencies using saved InfluxDB data
    • First, pull a square, sin, and noisy sin and plot using matplotlib so we know we have good vectors. Success!

Waveforms

Fika

Phil 4.10.20

Went grocery shopping yesterday. I go a little less than once every two weeks, and every time I go, the world has changed. Now, everyone wears masks. We wait in a spread-out line to enter the store. I bring everything home and stage it in the basement before cleaning it and bringing it to the kitchen. And yet it’s also spring, and the world is sunny and smells of growing things. I wake up to birds chirping in the morning, and opened the windows a couple of times this week.

D20

  • Trying to get ahold of Zach. Finally connected in the late afternoon and made some tweaks. Leaflet might be a good map API

GOES

  • I think today’s goal is to build a little python app that I can run from the command line that loads samples in real time into the InfluxDB. Square waves (SqW), sin waves (SiW), and noisy sin waves (NoW). Then I want to build one network that produces  NoW from SqW, and another that tries to detect the difference between an actual NsW and a synthesized one.
  • Working!

influxAndSim

  • Queries are returning as well. Here’s the last ten seconds from sin_p1_a1.0_o0.5:
FluxTable() columns: 8, records: 8
{'result': '_result', 'table': 0, '_start': datetime.datetime(2020, 4, 10, 14, 34, 53, 868766, tzinfo=datetime.timezone.utc), '_stop': datetime.datetime(2020, 4, 10, 14, 35, 3, 868766, tzinfo=datetime.timezone.utc), '_time': datetime.datetime(2020, 4, 10, 14, 34, 54, tzinfo=datetime.timezone.utc), '_value': 0.9690184703994814, '_field': 'val', '_measurement': 'sin_p1_a1.0_o0.5'}
{'result': '_result', 'table': 0, '_start': datetime.datetime(2020, 4, 10, 14, 34, 53, 868766, tzinfo=datetime.timezone.utc), '_stop': datetime.datetime(2020, 4, 10, 14, 35, 3, 868766, tzinfo=datetime.timezone.utc), '_time': datetime.datetime(2020, 4, 10, 14, 34, 55, tzinfo=datetime.timezone.utc), '_value': 0.9395197317147641, '_field': 'val', '_measurement': 'sin_p1_a1.0_o0.5'}
{'result': '_result', 'table': 0, '_start': datetime.datetime(2020, 4, 10, 14, 34, 53, 868766, tzinfo=datetime.timezone.utc), '_stop': datetime.datetime(2020, 4, 10, 14, 35, 3, 868766, tzinfo=datetime.timezone.utc), '_time': datetime.datetime(2020, 4, 10, 14, 34, 56, tzinfo=datetime.timezone.utc), '_value': 0.9006336224346869, '_field': 'val', '_measurement': 'sin_p1_a1.0_o0.5'}
{'result': '_result', 'table': 0, '_start': datetime.datetime(2020, 4, 10, 14, 34, 53, 868766, tzinfo=datetime.timezone.utc), '_stop': datetime.datetime(2020, 4, 10, 14, 35, 3, 868766, tzinfo=datetime.timezone.utc), '_time': datetime.datetime(2020, 4, 10, 14, 34, 57, tzinfo=datetime.timezone.utc), '_value': 0.8527486797091374, '_field': 'val', '_measurement': 'sin_p1_a1.0_o0.5'}
{'result': '_result', 'table': 0, '_start': datetime.datetime(2020, 4, 10, 14, 34, 53, 868766, tzinfo=datetime.timezone.utc), '_stop': datetime.datetime(2020, 4, 10, 14, 35, 3, 868766, tzinfo=datetime.timezone.utc), '_time': datetime.datetime(2020, 4, 10, 14, 34, 58, tzinfo=datetime.timezone.utc), '_value': 0.7963433540571716, '_field': 'val', '_measurement': 'sin_p1_a1.0_o0.5'}
{'result': '_result', 'table': 0, '_start': datetime.datetime(2020, 4, 10, 14, 34, 53, 868766, tzinfo=datetime.timezone.utc), '_stop': datetime.datetime(2020, 4, 10, 14, 35, 3, 868766, tzinfo=datetime.timezone.utc), '_time': datetime.datetime(2020, 4, 10, 14, 34, 59, tzinfo=datetime.timezone.utc), '_value': 0.7319812288475823, '_field': 'val', '_measurement': 'sin_p1_a1.0_o0.5'}
{'result': '_result', 'table': 0, '_start': datetime.datetime(2020, 4, 10, 14, 34, 53, 868766, tzinfo=datetime.timezone.utc), '_stop': datetime.datetime(2020, 4, 10, 14, 35, 3, 868766, tzinfo=datetime.timezone.utc), '_time': datetime.datetime(2020, 4, 10, 14, 35, tzinfo=datetime.timezone.utc), '_value': 0.6603053891601736, '_field': 'val', '_measurement': 'sin_p1_a1.0_o0.5'}
{'result': '_result', 'table': 0, '_start': datetime.datetime(2020, 4, 10, 14, 34, 53, 868766, tzinfo=datetime.timezone.utc), '_stop': datetime.datetime(2020, 4, 10, 14, 35, 3, 868766, tzinfo=datetime.timezone.utc), '_time': datetime.datetime(2020, 4, 10, 14, 35, 1, tzinfo=datetime.timezone.utc), '_value': 0.5820319962922194, '_field': 'val', '_measurement': 'sin_p1_a1.0_o0.5'}
    • Now I need to extract the useful info for ML processing. That was easy:
      for table in tables:
          print(table)
          rd:Dict
          for record in table.records:
              rd = record.values
              print("time = {}, name = {}, value = {}".format(rd["_time"], rd["_measurement"], rd["_value"]))
    • Hmmm. I can do a specific query:
      tables = query_api.query('from(bucket:"{}") |> range(start: -10s) |> filter(fn:(r) => r._measurement == "sin_p1_a1.0_o0.5")'.format(bucket))

      but using wildcards like * chokes

      tables = query_api.query('from(bucket:"{}") |> range(start: -10s) |> filter(fn:(r) => r._measurement == "sin_*")'.format(bucket))
  • Time to RTFM.
    • The syntax is specified using Extended Backus-Naur Form (“EBNF”). EBNF is the same notation used in the Go programming language specification, which can be found here. Not so coincidentally, InfluxDB is written in Go.
      • I wonder if these folks are ex-Googlers?
    • Wrong manual – the link above is for version 1.7. The query reference for 2.0 is here.
  • Basically, it’s a very simple query language, which is why you need all the tags. So here’s how it works.
    • First, create well-tagged data:
      def write_point(self, name:str, val:float, tags: Dict = {}):
          p = Point(name).field(self.keyfield, val).time(self.current_time)
          for key, val in tags.items():
              p.tag(key, val)
          self.write_api.write(bucket=self.bucket_name, record=p)
          print("\tto_influx {}".format(p.to_line_protocol()))
      
      def sin_wave(self, t:float, period:float = 1.0, amplitude:float = 1.0, offset:float = 0,name:str = None):
          tags = {"type": "sin", "period":period, "amplitude": amplitude, "offset":offset}
          if name == None:
              name = "sin_p{}_a{}_o{}".format(period, amplitude, offset)
          val = math.sin(t/period + offset)*amplitude
          self.write_point(name, val, tags)

      Here we have two methods, one that creates a value for a point of a sin wave, and one that writes the point. In this case, all the tags are stored as a Dict and passed as an argument to write_point, which is used by all the various functions. The output looks like this:

      to_influx noisy_sin_p7_a1.0_o3.5,amplitude=1.0,offset=3.5,period=7,type=noisy_sin val=0.13146298019922603 1586545970000000000
      to_influx square_p7_a1.0_o3.5,amplitude=1.0,offset=3.5,period=7,type=square val=0.0006153287497587468 1586545970000000000
      to_influx sin_p8_a1.0_o4.0,amplitude=1.0,offset=4.0,period=8,type=sin val=0.8523503891730094 1586545970000000000
      to_influx noisy_sin_p8_a1.0_o4.0,amplitude=1.0,offset=4.0,period=8,type=noisy_sin val=0.717585870814358 1586545970000000000
    • To query this, we do the following:
      query_api = self.client.query_api()
      # Queries have these basic components, connected by the forward operator (|>) which applies each step in sequence:
      # source 'from (bucket: "my-bucket")
      # range (relative): range(start: -1h, stop: -10m). The stop is optional. If left out, all results up to the present will be returned
      # range (absolute): range(start: 2018-11-05T23:30:00Z, stop: 2018-11-06T00:00:00Z)
      # filter : an anonymous function that compares string values with >, <, and  == comparitors. There are no wildcards. This is why tagging is important    tables = 
      

      Just remember that all tags are regarded as strings (as you can see in the filter_func string below), so be careful in generating them if they represent floating point values!

      filter_func = 'r.type == "sin" and r.period == "4"'
      tables = query_api.query('from(bucket:"{}") |> range(start: -10s) |> filter(fn:(r) => {})'.format(bucket, filter_func))
    • This query gives the following result:
      FluxTable() columns: 12, records: 7
      type = sin period = 4, time = 2020-04-10 19:16:44+00:00, name = sin_p4_a1.0_o2.0, value = -0.7178200203799832
      type = sin period = 4, time = 2020-04-10 19:16:45+00:00, name = sin_p4_a1.0_o2.0, value = -0.7349996180484573
      type = sin period = 4, time = 2020-04-10 19:16:46+00:00, name = sin_p4_a1.0_o2.0, value = -0.7517198648809216
      type = sin period = 4, time = 2020-04-10 19:16:47+00:00, name = sin_p4_a1.0_o2.0, value = -0.7679703112673733
      type = sin period = 4, time = 2020-04-10 19:16:48+00:00, name = sin_p4_a1.0_o2.0, value = -0.7837408012077955
      type = sin period = 4, time = 2020-04-10 19:16:49+00:00, name = sin_p4_a1.0_o2.0, value = -0.7990214786593275
      type = sin period = 4, time = 2020-04-10 19:16:50+00:00, name = sin_p4_a1.0_o2.0, value = -0.8138027936959693
  • And that’s enough for the day/week, I think

Phil 4.8.20

D20:

  • Talk to Zach about chart size bug?
    • Yes! The charts are fixed. We also went through the rest of the punch list.
    • Had to update the json file to handle date and other meta information
  • We are going to need a top level dashboard, something like number of countries in the DANGER, WARNING, and CONTROLLED buckets

COVID Twitter

  • Continue getting spreadsheets ingested.
  • Got the first one in, trying all of them now. Had to remember about INSERT IGNORE
  • It’s chugging along!

GOES

  • Got the db behaving! influxWithData
  • The first and most important thing is that you have to multiply unixtime by 1,000,000,000 for it to work. Got that from this page in the 1.7 guide
  • Second is how tags can be added in code:
    p = Point(self.name).field(self.keyfield, t[0]).time(t[1])
    for key, val in self.tags_dict.items():
        p.tag(key, val)

    That’s pretty nice.

  • Another nice feature that I discovered looking through the code is that there is a to_line_protocol() method, which produces correct lines. It looks like the InfluxDB parser doesn’t like spaces. Here’s an example of correct lines that I am reading in:
    measure_1,tagKey_1=tagValue_11,tagKey_2=tagValue_12,tagKey_3=tagValue_13 val_1=0.0 1586352302000000000
    measure_1,tagKey_1=tagValue_11,tagKey_2=tagValue_12,tagKey_3=tagValue_13 val_1=0.09983341664682815 1586352312000000000
    measure_1,tagKey_1=tagValue_11,tagKey_2=tagValue_12,tagKey_3=tagValue_13 val_1=0.19866933079506122 1586352322000000000
    measure_1,tagKey_1=tagValue_11,tagKey_2=tagValue_12,tagKey_3=tagValue_13 val_1=0.29552020666133955 1586352332000000000
    measure_1,tagKey_1=tagValue_11,tagKey_2=tagValue_12,tagKey_3=tagValue_13 val_1=0.3894183423086505 1586352342000000000
    measure_1,tagKey_1=tagValue_11,tagKey_2=tagValue_12,tagKey_3=tagValue_13 val_1=0.479425538604203 1586352352000000000

    The reason that I’m reading in data is that the direct, SYNCHRONOUS writes to the database are pretty slow. Looking into that.

  • Coming up next, queries

Phil 4.7.20

D20:

  • Talk to Zach about chart size bug?
  • We are going to need a top level dashboard, something like number of countries in the DANGE, WARNING, and CONTROLLED buckets
  • Should look into using scipy’s linregress method to get accuracy values – done!

COVID Twitter

    • Read xls files into db (using this)
    • Wow, you can recursively get files in three lines, including the import:
      import glob
      for filename in glob.iglob("./" + '**/*.xls', recursive=True):
          print(filename)
    • Had to do a bunch of things to get Arabic to score correctly. I think I need to set the database to:
      alter database covid_misinfo character set utf8 collate utf8_general_ci;

      , then set the table to utf-8, like so

      DROP TABLE IF EXISTS `table_tweets`;
      /*!40101 SET @saved_cs_client     = @@character_set_client */;
      /*!40101 SET character_set_client = utf8 */;
      CREATE TABLE `table_tweets` (
        `GUID` bigint(20) NOT NULL,
        `date` datetime NOT NULL,
        `URL` varchar(255) DEFAULT NULL,
        `contents` mediumtext NOT NULL,
        `translation` varchar(255) DEFAULT NULL,
        `author` varchar(255) DEFAULT NULL,
        `name` varchar(255) DEFAULT NULL,
        `country` varchar(255) DEFAULT NULL,
        `city` varchar(255) DEFAULT NULL,
        `category` varchar(255) DEFAULT NULL,
        `emotion` varchar(255) DEFAULT NULL,
        `source` varchar(255) DEFAULT NULL,
        `gender` varchar(16) DEFAULT NULL,
        `posts` int(11) DEFAULT NULL,
        `followers` int(11) DEFAULT NULL,
        `following` int(11) DEFAULT NULL,
        `influence_score` float DEFAULT NULL,
        `post_title` varchar(255) DEFAULT NULL,
        `post_type` varchar(255) DEFAULT NULL,
        `image_url` varchar(255) DEFAULT NULL,
        `brand` varchar(255) DEFAULT NULL,
        PRIMARY KEY (`GUID`)
      ) ENGINE=InnoDB DEFAULT CHARSET= utf8;

      Anyway, it’s now working! (RT @naif_khalaf رحلة تطوير لقاح وقائي لمرض كورونا. استغرقت ٤ سنوات من المعمل لحيوانات التجارب للدراسات الحقلية على الإبل ثم للدراسة السريرية الأولية على البشر المتطوعين. ولازالت مستمرة. https://t.co/W3MjaFOAoC)

GOES

  • Write, visualize, and query test data
        • Writing seems to be working? I don’t get any errors, but I can’t see anything show up
        • Here’s an example of the data in what I think is correct line format:
          measure_1, tagKey_1=tagValue_11 val_1=0.0 1586270395
          measure_1, tagKey_1=tagValue_11 val_1=0.09983341664682815 1586270405
          measure_1, tagKey_1=tagValue_11 val_1=0.19866933079506122 1586270415
          measure_1, tagKey_1=tagValue_11 val_1=0.2955202066613396 1586270425
          measure_1, tagKey_1=tagValue_11 val_1=0.3894183423086505 1586270435
          measure_1, tagKey_1=tagValue_11 val_1=0.479425538604203 1586270445
          measure_1, tagKey_1=tagValue_11 val_1=0.5646424733950355 1586270455
          measure_1, tagKey_1=tagValue_11 val_1=0.6442176872376911 1586270465
          measure_1, tagKey_1=tagValue_11 val_1=0.7173560908995228 1586270475
          measure_1, tagKey_1=tagValue_11 val_1=0.7833269096274834 1586270485
          measure_1, tagKey_1=tagValue_11 val_1=0.8414709848078965 1586270495
          measure_1, tagKey_1=tagValue_11 val_1=0.8912073600614354 1586270505

          Here’s how I’m writing it:

          def to_influx(self, client:InfluxDBClient, bucket_name:str, org_name:str):
              write_api = client.write_api(write_options=SYNCHRONOUS)
              for i in range(len(self.measurement_list)):
                  t = self.measurement_list[i]
                  for key, val in self.tags_dict.items():
                      p = Point(self.name).tag(key, val).field(self.keyfield, t[0])
                      write_api.write(bucket=bucket_name, record=p)
                      print("writing {}, {}={}, {}={} {}".format(self.name, key, val, self.keyfield, t[0], t[1]))

          That seems to work. Here’s the output while it’s storing:

          writing measure_10, tagKey_1=tagValue_101, val_10=-0.34248061846961253 1586277701
          writing measure_10, tagKey_1=tagValue_101, val_10=-0.2469736617366209 1586277691​
          writing measure_10, tagKey_1=tagValue_101, val_10=-0.1489990258141953 1586277681​
          writing measure_10, tagKey_1=tagValue_101, val_10=-0.04953564087836742 1586277671​
          writing measure_10, tagKey_1=tagValue_101, val_10=0.05042268780681122 1586277661
          

          I get no warnings or errors, but the Data Explorer is blank: influxdb

        • Oh, you have to use Unix Timestamps in milliseconds (timestamp * 1000):
          mm.add_value(val, ts*1000)
        • Ok, it’s working, but my times are wrong wrong_times


  • 1:00 IRAD meeting

ML Seminar

Phil 4.6.20

Based on a chat with David K, I’m going to see if I can add a field for the detail view that says whether the estimate is better or worse than yesterday’s. Something like “Today’s estimate is x days better/worse than yesterday

  • And it seems to be working. Need to get it on the website next

Get twitter parser to MySQL converter built

  • Created the table in mySQL
  • Dumped the .sql file (with just the table) to src/data

Continue to set up influx on laptop.

    • Set a fixed IP address – done! In lubuntu, it’s done through Settings->Advanced Network Configuration. I tried just setting the address manually, but it didn’t like that. So I let the dhcp automatically find an address and didn’t delete the static one, and now I can reach both?
      Pinging 192.168.1.183 with 32 bytes of data:
      Reply from 192.168.1.183: bytes=32 time=1ms TTL=64
      Reply from 192.168.1.183: bytes=32 time<1ms TTL=64
      Reply from 192.168.1.183: bytes=32 time<1ms TTL=64
      Reply from 192.168.1.183: bytes=32 time<1ms TTL=64 Ping statistics for 192.168.1.183:     Packets: Sent = 4, Received = 4, Lost = 0 (0% loss), Approximate round trip times in milli-seconds:     Minimum = 0ms, Maximum = 1ms, Average = 0ms C:\Users\Phil>ping 192.168.1.111
      
      Pinging 192.168.1.111 with 32 bytes of data:
      Reply from 192.168.1.111: bytes=32 time=297ms TTL=64
      Reply from 192.168.1.111: bytes=32 time<1ms TTL=64
      Reply from 192.168.1.111: bytes=32 time<1ms TTL=64
      Reply from 192.168.1.111: bytes=32 time<1ms TTL=64
      
      Ping statistics for 192.168.1.111:
          Packets: Sent = 4, Received = 4, Lost = 0 (0% loss),
      Approximate round trip times in milli-seconds:
          Minimum = 0ms, Maximum = 297ms, Average = 74ms
    • And I’m connected over the local network! influxRunning
    • Generate and store a set of square and sin waves, store and retrieve them.
    • Built a generator and can save to a file, but it looks like I need to use the API? Here’s the Python page.
    • How to do it?
      import rx
      from rx import operators as ops
      
      from influxdb_client import InfluxDBClient, Point, WriteOptions
      from influxdb_client.client.write_api import SYNCHRONOUS
      
      _client = InfluxDBClient(url="http://localhost:9999", token="my-token", org="my-org")
      _write_client = _client.write_api(write_options=WriteOptions(batch_size=500,
                                                                   flush_interval=10_000,
                                                                   jitter_interval=2_000,
                                                                   retry_interval=5_000))
      
      """
      Write Line Protocol formatted as string
      """
      _write_client.write("my-bucket", "my-org", "h2o_feet,location=coyote_creek water_level=1.0 1")
      _write_client.write("my-bucket", "my-org", ["h2o_feet,location=coyote_creek water_level=2.0 2",
                                                  "h2o_feet,location=coyote_creek water_level=3.0 3"])
  • COVID Misinfo meeting
    • Talked about the lateral thinking paper, and that we basically want to automate that.
    • We’re going to put some tweet threads together for misinfo, ambiguous, and trustworthy and have a small Twitter party next week
    • Finish getting the extractor running. There will be other tables as we start to figure things out

And I am done for the day. I hate this fucking timeline


Phil 4.5.20

The initial version of DaysToZero is up! Working on adding states now

dtz_launch

Got USA data working. New York looks very bad:

New_York_4_5_2020

Evaluating the fake news problem at the scale of the information ecosystem

  • “Fake news,” broadly defined as false or misleading information masquerading as legitimate news, is frequently asserted to be pervasive online with serious consequences for democracy. Using a unique multimode dataset that comprises a nationally representative sample of mobile, desktop, and television consumption, we refute this conventional wisdom on three levels. First, news consumption of any sort is heavily outweighed by other forms of media consumption, comprising at most 14.2% of Americans’ daily media diets. Second, to the extent that Americans do consume news, it is overwhelmingly from television, which accounts for roughly five times as much as news consumption as online. Third, fake news comprises only 0.15% of Americans’ daily media diet. Our results suggest that the origins of public misinformedness and polarization are more likely to lie in the content of ordinary news or the avoidance of news altogether as they are in overt fakery.

Phil 4.3.20

Temp is up a bit this morning, which, of course, I’m overreacting to.

Need to get started on State information from here: https://raw.githubusercontent.com/nytimes/covid-19-data/master/us-states.csv

Generated some favicons from here: https://favicon.io/favicon-generator/, which, of course we didn’t use

Getting close to something that we can release

GOES:

  • Update Linux on laptop and try Influx there. Nope. The laptop is hosed. hosed
  • Grabbing another computer to configure. I mean, worst case, I can set up the work laptop as an Ubuntu box. I’d love to know if Influx would work FIRST, though. Looks like I have to. My old dev box won’t boot. Backing up.
  • Installed Debian on the work laptop. It seems to be booting? Nope:
  • I guess we’ll try Ubuntu again? Nope. Trying one more variant.
  • Trying lubuntu. It uses different drivers for some things, and so far hasn’t frozen or blocked yet. It works!
  • And now the Docker version (docker run –name influxdb -p 9999:9999 quay.io/influxdb/influxdb:2.0.0-beta) works too. Maybe because the system got upgraded?
  • 11:00 IRAD Meeting
    • Send note about NOAA being a customer for simulated anomalies for machine learning

Phil 4.2.20

Wake up, shower, write some code. The linear estimate is now integrated with the predictions. I think that tells the story well. Rather than Italy, let’s look at Switzerland:

Switzerland_4_2_2020

Now I need to put together a punch list of final issues (I’m worried most about load times and performance under high demand), get the URL(s) and publish!

Punch list is done. Zach is getting the domains.

Here’s the UI description: help diagram

GOES: 8 hours

  • Status report for March
  • InfluxDB!
  • Hmm – I appear to have broken Docker? No just being dumb with commands. Here’s what I needed:
    • docker container run -it –name influx2 ubuntu /bin/sh
    • Success! teminal3
  • Time to RTFM: v2.docs.influxdata.com/v2.0/get-started/
  • getting my Ubuntu image current, using
    • apt update
    • apt upgrade
    • apt wget
    • wget https://dl.influxdata.com/influxdb/releases/influxdb_2.0.0-beta.7_linux_amd64.tar.gz
    • tar -xvzf influxdb_2.0.0-beta.7_linux_amd64.tar.gz
    • created a user so I can have things like tab complete (adduser). Created phil with regular test pwd
    • Hmm influxd isn’t on the path. Going to try running it in its directory
    • Things are happening! teminal4
    • But the webserver isn’t visible at localhost:9999 (ERR_CONNECTION_REFUSED). Drat! Still happens when I run as root
  • Town hall meeting

Phil 4.1.20

Working from home has a different rhythm. I work in segments with home chores mixed in. Today I’m doing this at 6:00, along with some coding. Then some morning exercise, breakfast, and work till noon. Ride, lunch and more work till about 3:00. By that time my brain is broken, and I take a break and do light chores. Today I may finally get my road bike ready for spring. Then simple work like commenting for a few hours. In the evenings I find I like watching shows about competent people fixing things and making them better. Bitchin’ Rides is extremely soothing.

D20:

  • Fixing dates
  • integrating the estimated deaths from rate and current deaths as area under the curve until zero.
  • Work on documentation. Also make sure word wrap works
  • This. Is. Bad.

Italy_4_1_2020

  • Once more, this is Italy. What I’ve done is round-tripped the rates to produce an estimate of total deaths. If calculating rates is taking the derivative, calculating a death prediction is integration. So, if the calculations are right, and Italy is at zero new deaths around April 17th, the toll is around 27 thousand total deaths. That’s 0.04% of the population. If those numbers hold for the US at 327 million, that’s a total of 145,550. The White House is estimating numbers of 100,000 to 240,000, which means their average prediction is that we will fare worse than Italy.
  • Fixed bugs, worked with Zach, made progress. Aaron is starting to appear again!

GOES

  • Tweak John’s slides
  • More on saving and restoring docker containers. I think I’m close. Then install InfluxDB and test if I can see the dashboard
  • Still having problems. I can create, run, add, delete, and tag the images, but I can’t run them. I think I’m getting ahead of myself. Back to reading

teminal

So it turns out that I was doing everything right but the load. Here’s how it works

  1. docker run container -it –name imagename some-os /bin/sh
  2. Install what needs to be installed. Poke around, save things, etc
  3. docker container commit imagename modified-os
  4. docker save modified-os> modified-os.tar
  5. docker rmi modified-os
  6. docker load < modified-os.tar
  7. docker run container -it –name imagename modified-os /bin/sh

teminal2


Phil 3.31.2020

I need to go grocery shopping today. A friend of mine has come down with the virus. He’s in his 30’s, and I’m feeling vulnerable. I went down to the shop and dug up my painting masks. Turns out I have a few, so that’s what I’m going shopping with. Here’s why, from the NY Times:

When researchers conducted systematic review of a variety of interventions used during the SARS outbreak in 2003, they found that washing hands more than 10 times daily was 55 percent effective in stopping virus transmission, while wearing a mask was actually more effective — at about 68 percent. Wearing gloves offered about the same amount of protection as frequent hand-washing, and combining all measures — hand-washing, masks, gloves and a protective gown — increased the intervention effectiveness to 91 percent.

Podcast with BBC’s misinformation reporter: https://podcasts.apple.com/gb/podcast/the-political-party/id595312938?i=1000470048553


  • A friend of mine who works in Whitehall has told me that the army are going to be on the streets this week arresting people who don’t listen to this podcast. If that sounds familiar, you’ll be aware that this crisis has already been fertile ground for disinformation. Marianna Spring is a BBC specialist reporter covering disinformation and social media. In this fascinating interview, Marianna reveals how disinformation and misinformation gets so widely shared, why we share it, how to spot it, what the trends are, how it differs around the world and so much more. This is a brilliant insight not just into the sharing of inaccurate information, but into human behaviour.


D20

  • Changed the calculations from the linear regression to handle cases where the virus is under control, like China – first pass is done
  • Have the linear regression only go back some number of weeks/months. I’m worried about missing a second wave
  • Need to add a disclaimer about the quality of the predictions is dependent on the quality of the data, and that we expect that as poorer countries come online, these trends may be erratic and inaccurate.
  • Add an UNSET state. The ETS will only set the state if it is UNSET. This lets regression predictions to be used until the ETS is working well – done
  • I think showing the linear and ETS mean prediction is a good way to start including ETS values
  • Found the page that shows how to adjust parameters: https://www.statsmodels.org/stable/examples/notebooks/generated/exponential_smoothing.html

GOES

  • Try to create an image from the stored tar
  • Start setting up InfluxDB2

IRAD Meeting at 2:00

ML Group at 4:00

  • Put together a list of potential papers to present. No need, I’ll do infinitely wide networks
  • Had just a lovely online evening of figuring out how to use some (terrible!) webex tools, and trying to figure out Neural ODEs. It was an island of geeky normalcy for a few hours. This may be a more comprehensible writeup.