
Cornell University was having a sale, so I got a book:
- Rarely recognized outside its boundaries today, the Pacific Northwest region known at the turn of the century as the Inland Empire included portions of the states of Washington and Idaho, as well as British Columbia. Katherine G. Morrissey traces the history of this self-proclaimed region from its origins through its heyday. In doing so, she challenges the characterization of regions as fixed places defined by their geography, economy, and demographics. Regions, she argues, are best understood as mental constructs, internally defined through conflicts and debates among different groups of people seeking to control a particular area’s identity and direction. She tells the story of the Inland Empire as a complex narrative of competing perceptions and interests.
DtZ:
- Change the code so that there is a 30 day prediction based on the current rates regardless of trend. I think it tells the story of second waves better:

GPT-2 Agents
- The ACSOS paper was rejected, so this is now the only path going forward for mapmaking research.
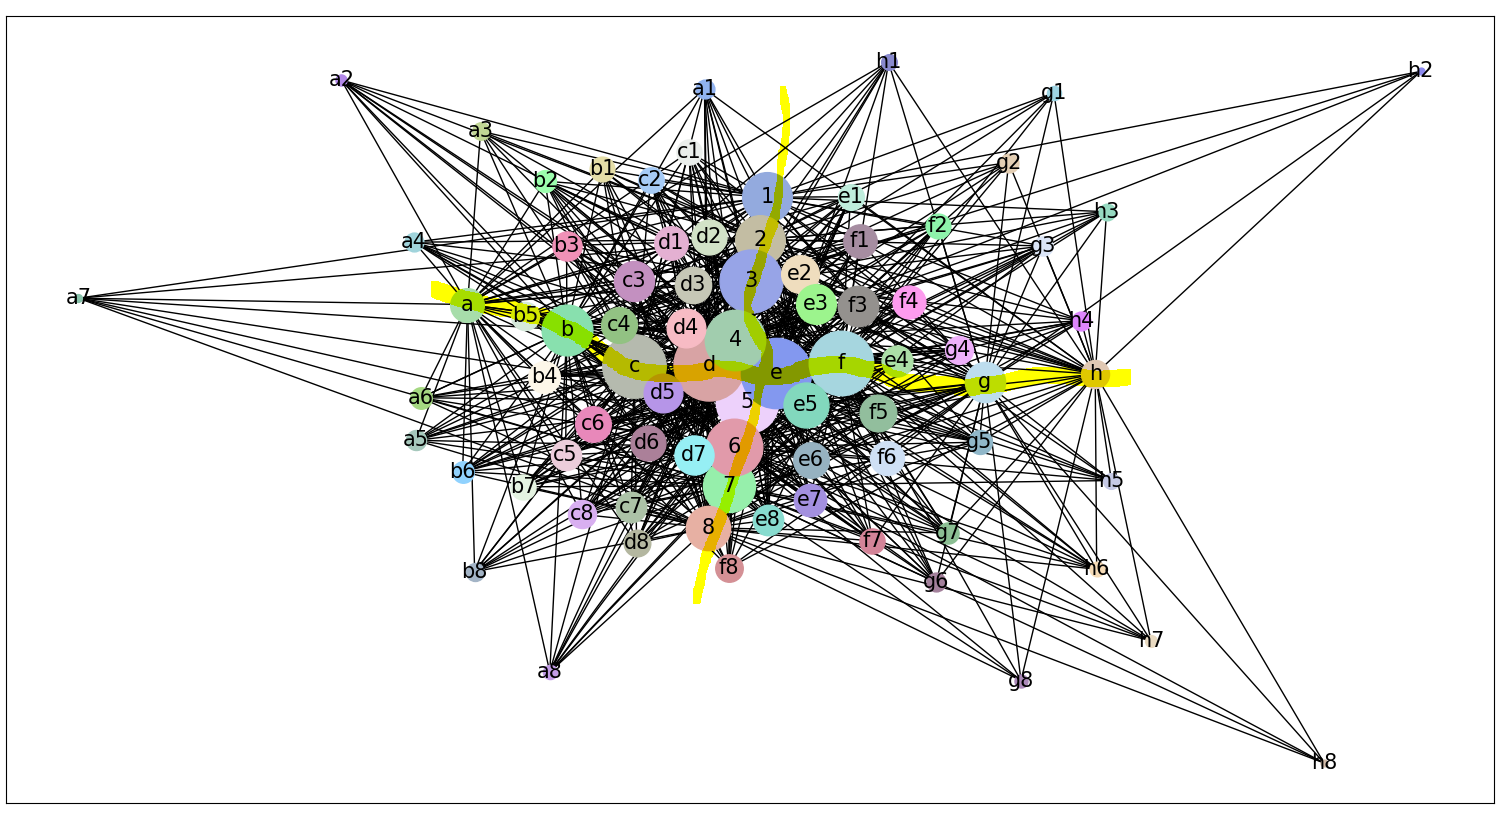
- Used the known_nearest to produce a graph:


- The graph on the left is the full graph, and the right is culled. First, note that node c is not in the second graph. There is no confirming link, so we don’t know if it’s an accident. Node e is also not on the chart, because it has no confirming link back through any 2-edge path.
- Ok, I tried it for the first time on the chess data. There is a bug where [a-h] and [1-8] are showing up as nodes that I have to figure out. But they show up in the right way! Orthogonal and in order!
- The bug seems to be in the way that List.extend() works. It seems to be splitting the string (which is a List, duh), and adding those elements as well? Nope, just doing one nesting too many
- Ok, here are the first results. The first image is of all neighbors. The second is of only verified nearest neighbors (at least one edge chain of 2 that lead back to the original node)
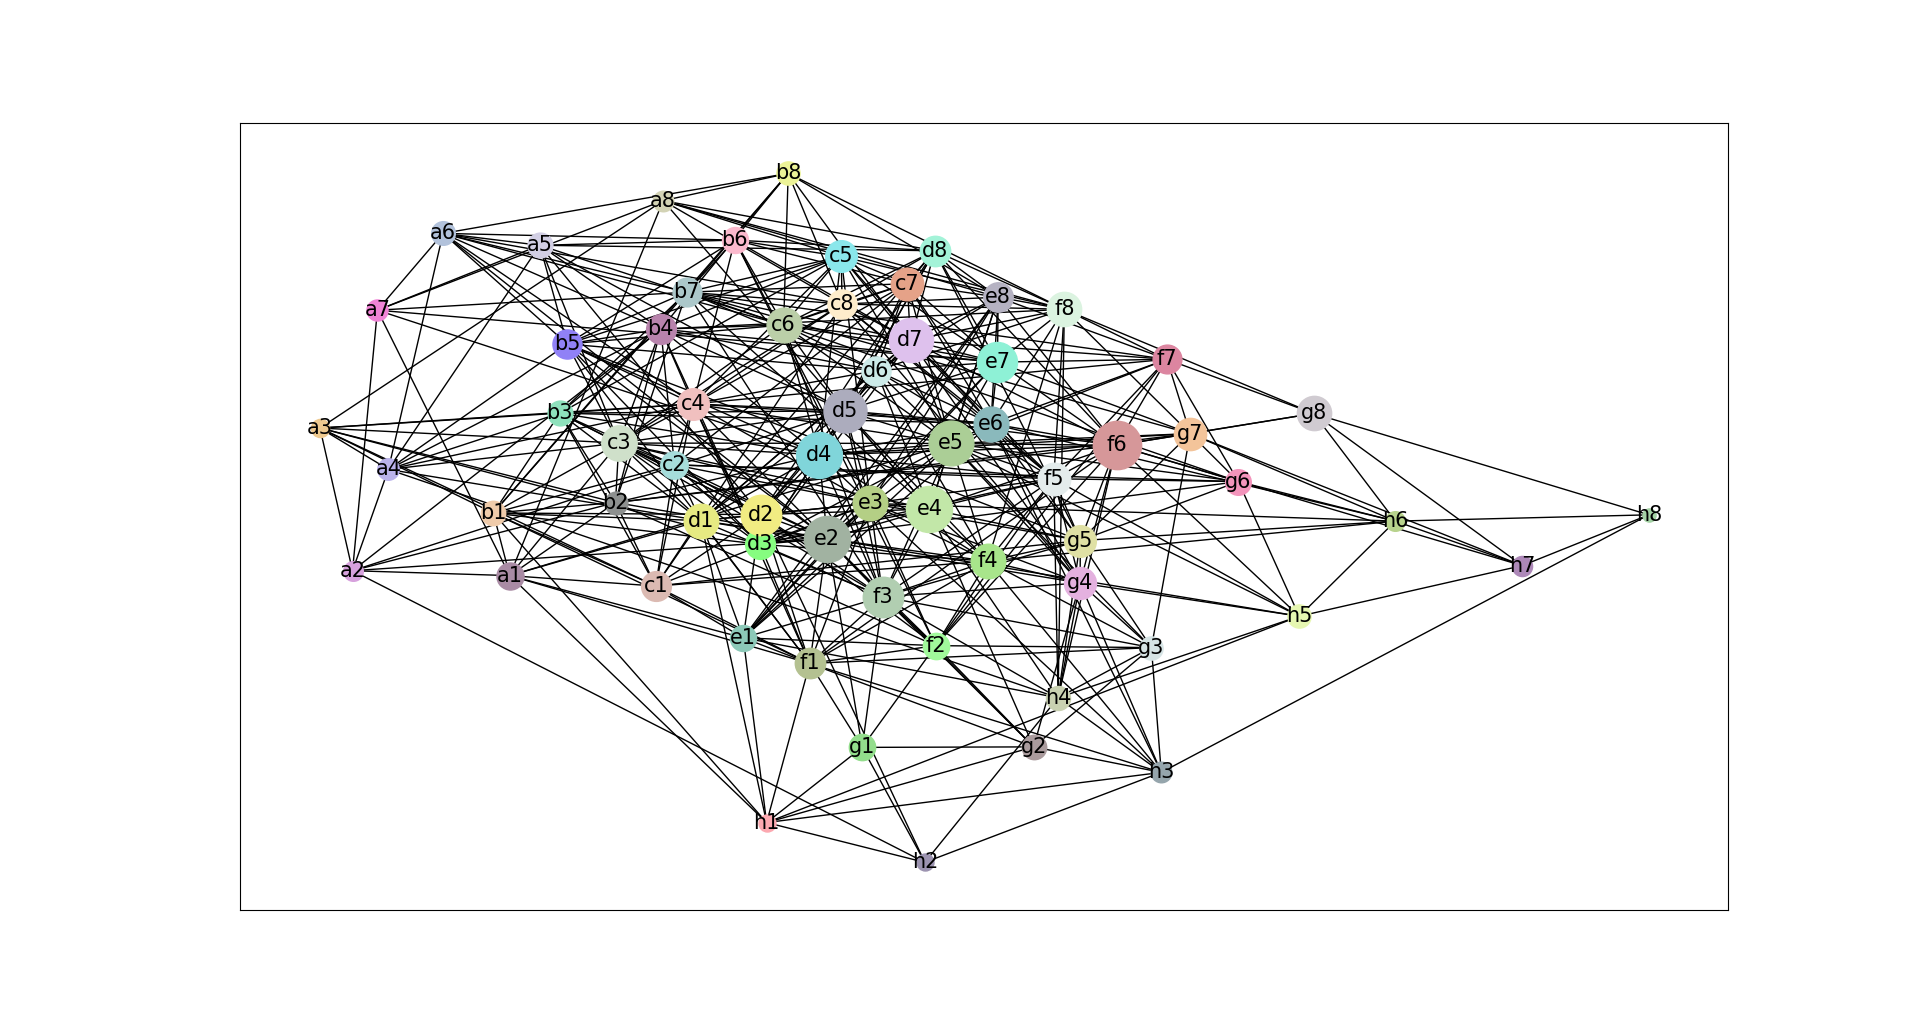

- In both cases, the large-scale features of the chessboard are visible. There is a progression from 1 to 8, and a to h. It seems clearer to me in the lower image, and the grid-like nature is more visible. I think I need to get the interactive manipulation working, because some of this could be drawing artifacts
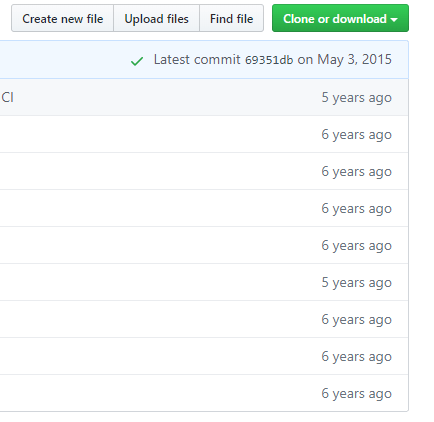
- Trying out the networkx_viewer. A little worried about this though:
- And rightly so:
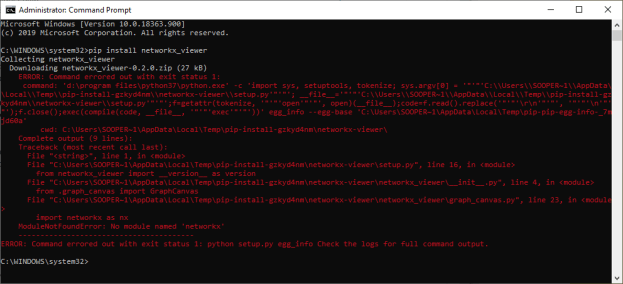
- Going to try cloning and fixing. Nope. It is waaaaaaayyyyyy broken, and depends on earlier version of networkx
- Networkx suggests Gephi, and there is a way to export graphs from networkx. Trying that
- Seems usable?

GOES
- Kind of stuck. Waiting on Vadim
- Probably will be working on a couple of SBIRs for the next few weeks
