7:00 – 5:30 ASRC NASA
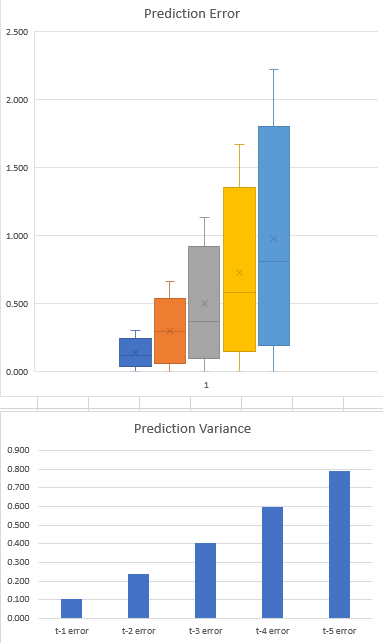
- Realized that error calculation for Holt can simply be error from the horizontal line from each prediction. There would be a distribution for T-1, T-2, T-3 … T-n. Later, when we get fancy, we can use the phi curve. So dumb.
- Continuing my deep neural network writeup
- Continuing Holt-Winters work with Aaron – probability distributions!
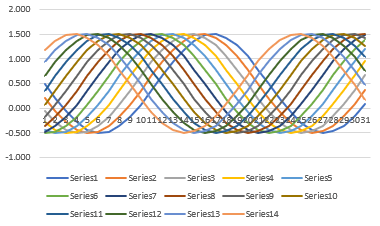
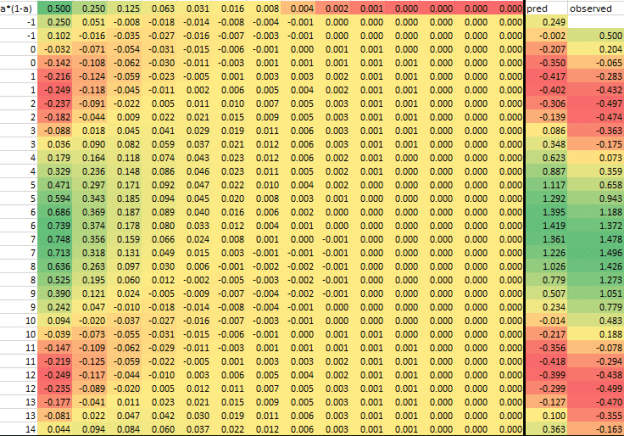
- Ok, I think I’ve got this stupid thing figured out. Below is a screenshot of the table of predictions. These predictions are based on applying exponential smoothing to a history of sine waves:
- The table consists of a set of predictions and their observed values (not sure why the time steps in the column on the left are duplicated. Need to fix that:
- I can then make a table that contains each prediction as a line stretching into the future:
- This “population of prediction errors” can then be used to calculate the amount of error in our forecast:
- This will work for any of the prediction schemes. We just have to store all predictions and observed.
- Here’s the spreadsheet: ExponentialSmoothing2
- Ok, I think I’ve got this stupid thing figured out. Below is a screenshot of the table of predictions. These predictions are based on applying exponential smoothing to a history of sine waves:
- Ping Shimei – campus closed
- Ping Don – campus closed
Hammerhead