Need to integrate the DB into the interactive code
Need to clean up the interactive code so that there is a callback dispatcher that handles all the ins and outs, rather than the current multiple callbacks
Need to make a component class that keeps the html/dash elements along with names, Inputs and Outputs so that the important elements aren’t scattered all over the code
SBIR
9:15 Standup
11:00 Meeting with Bob
More abstracts. Use some of the text from the note to Antonio?
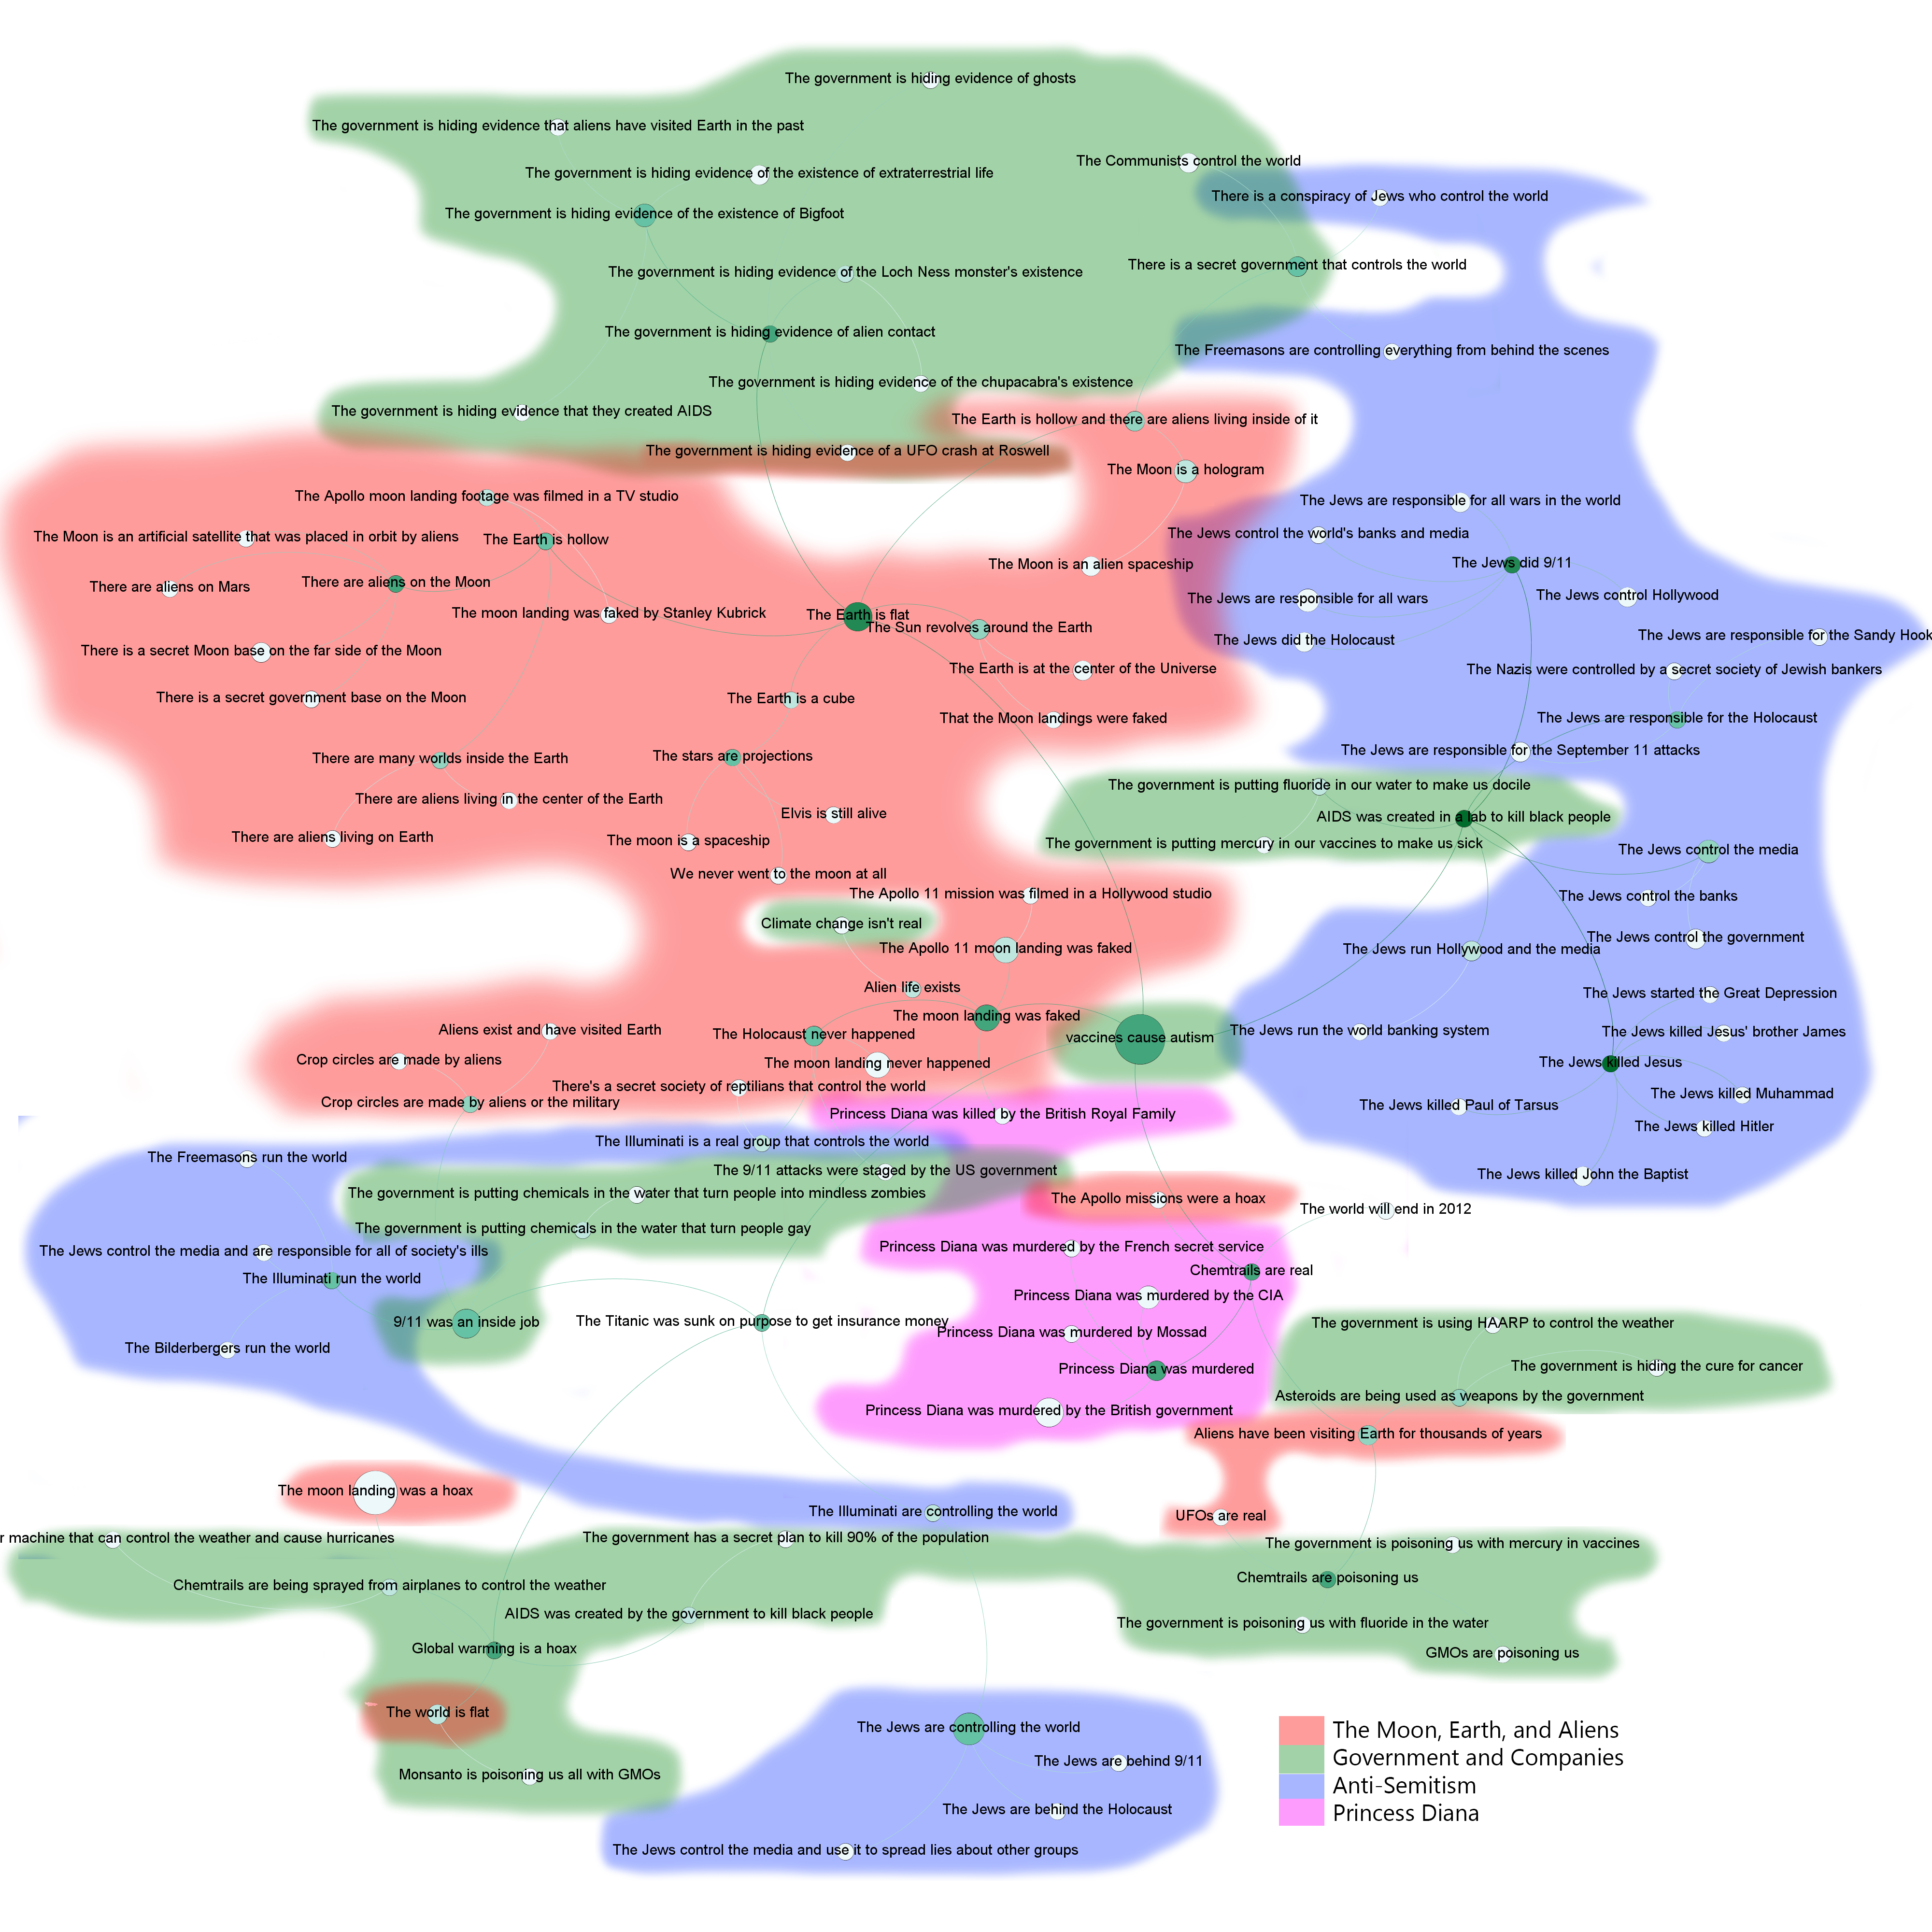
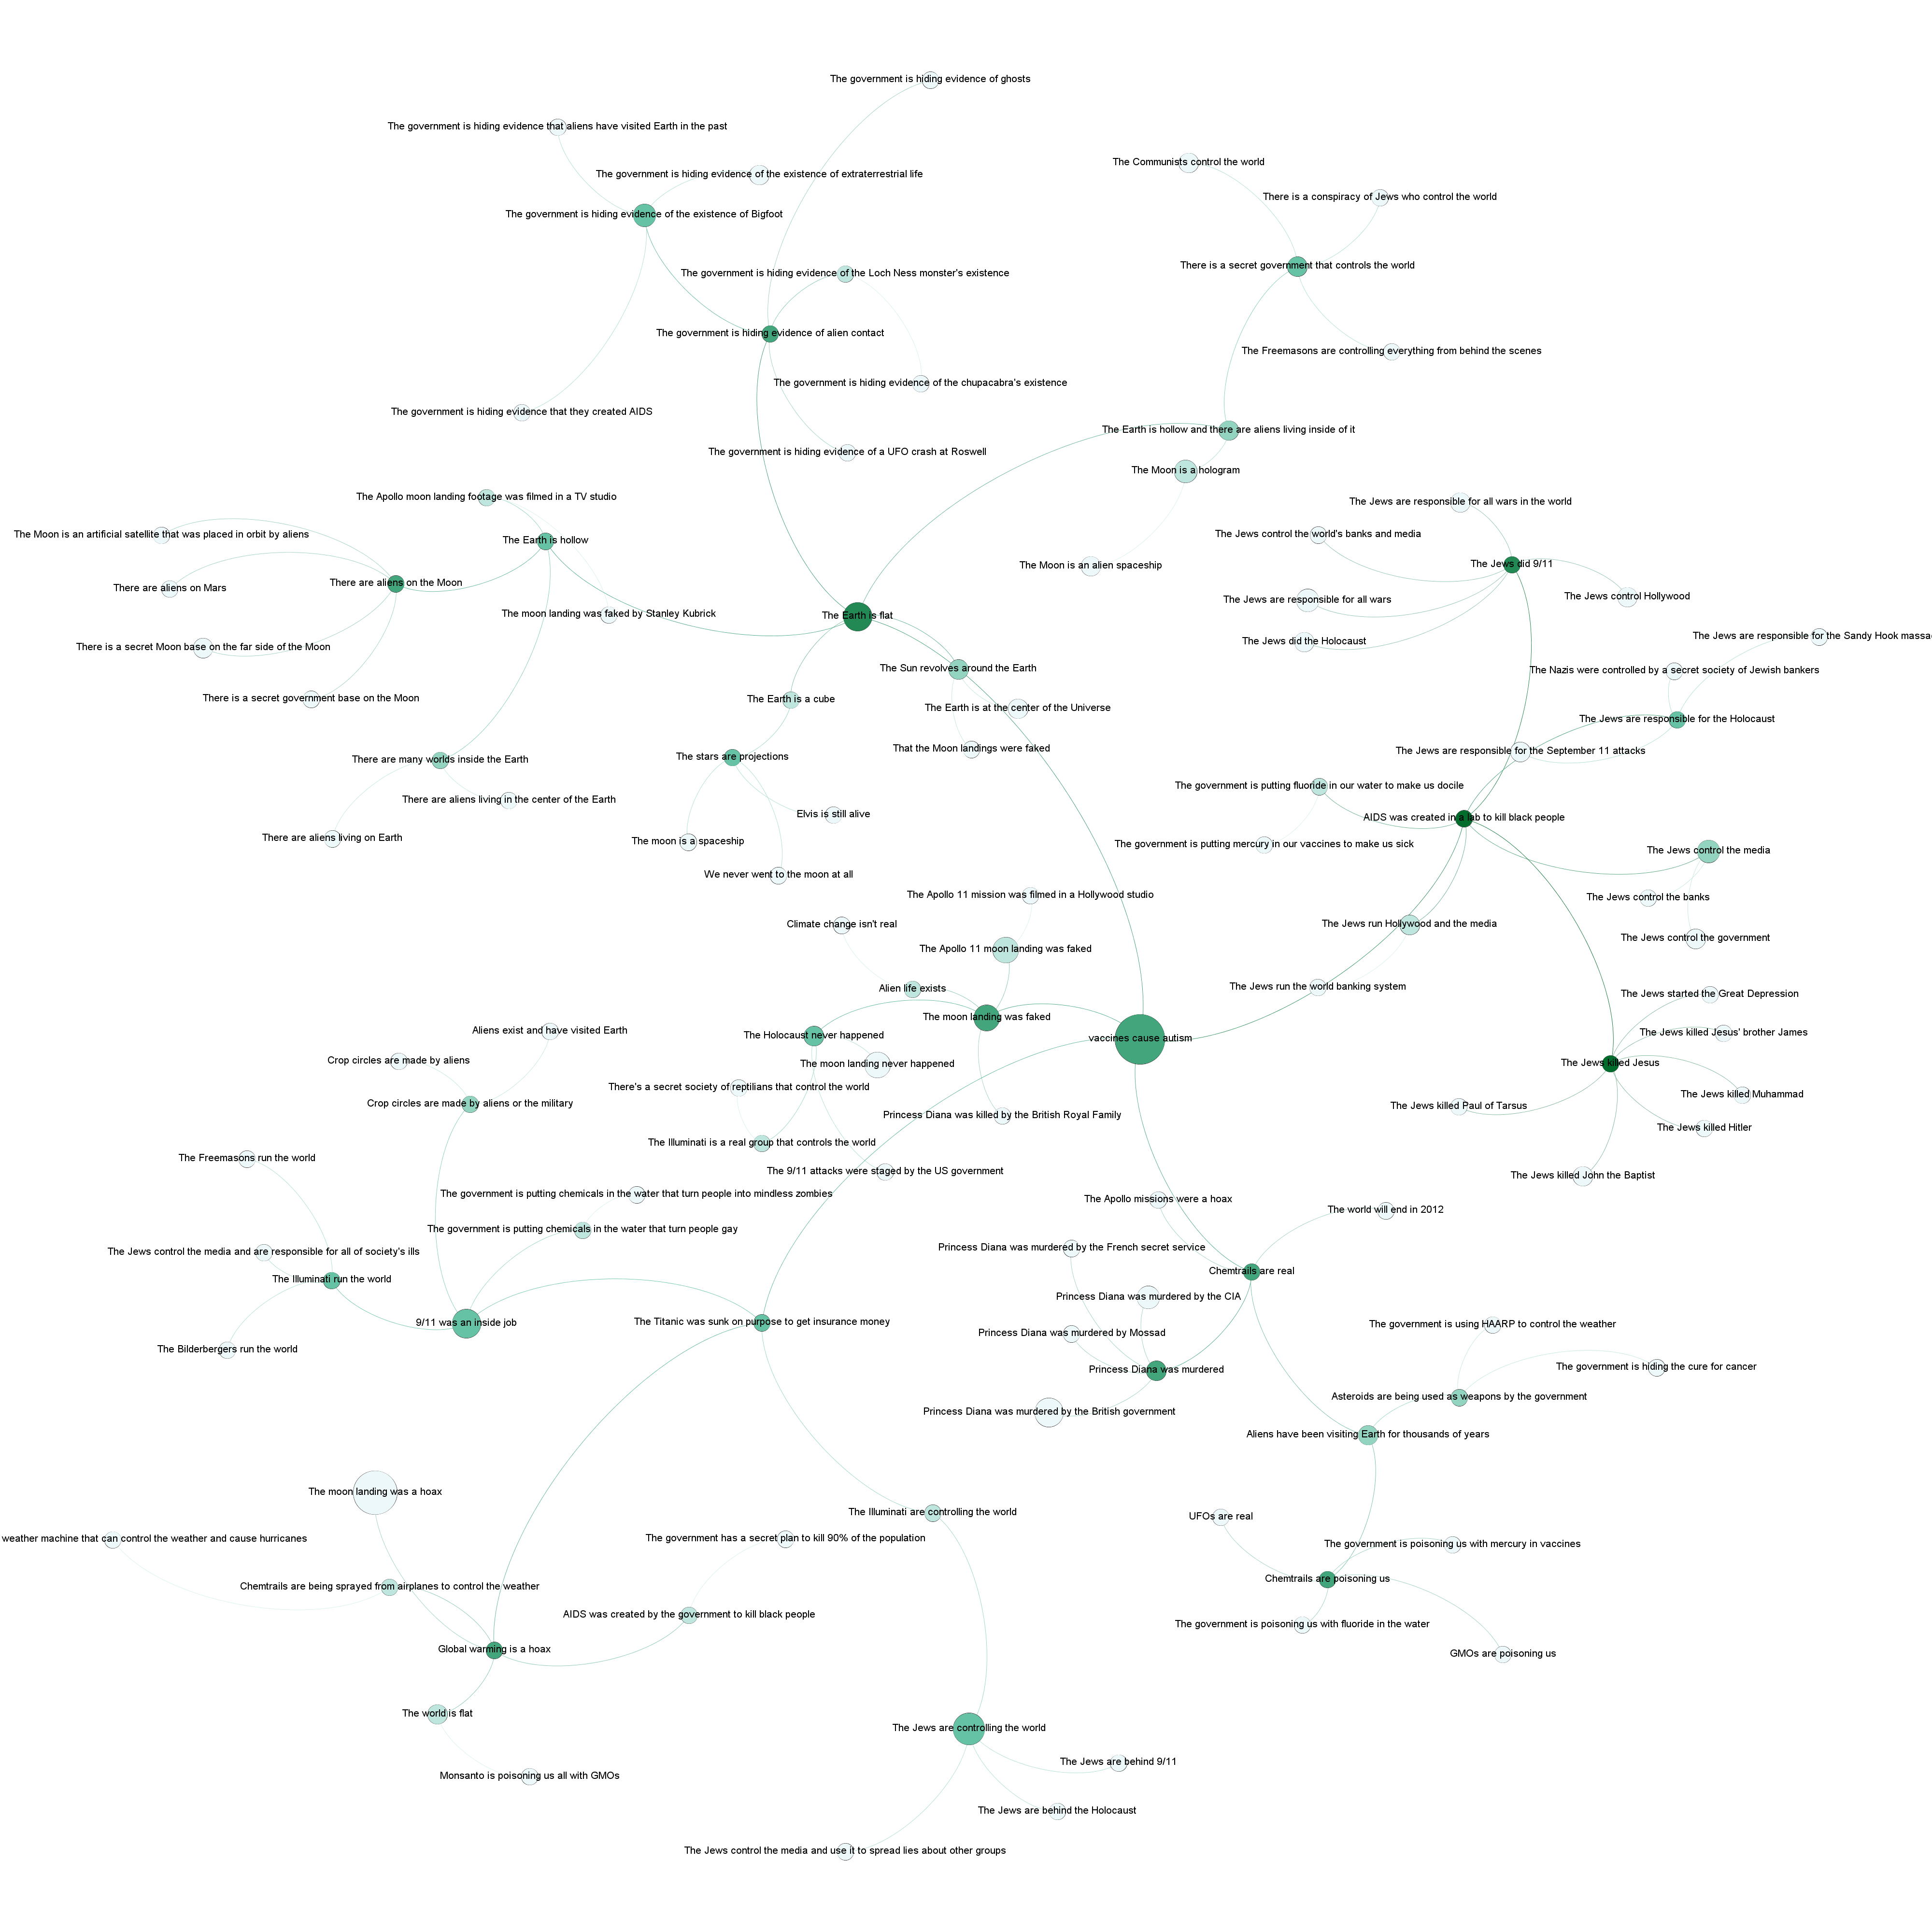
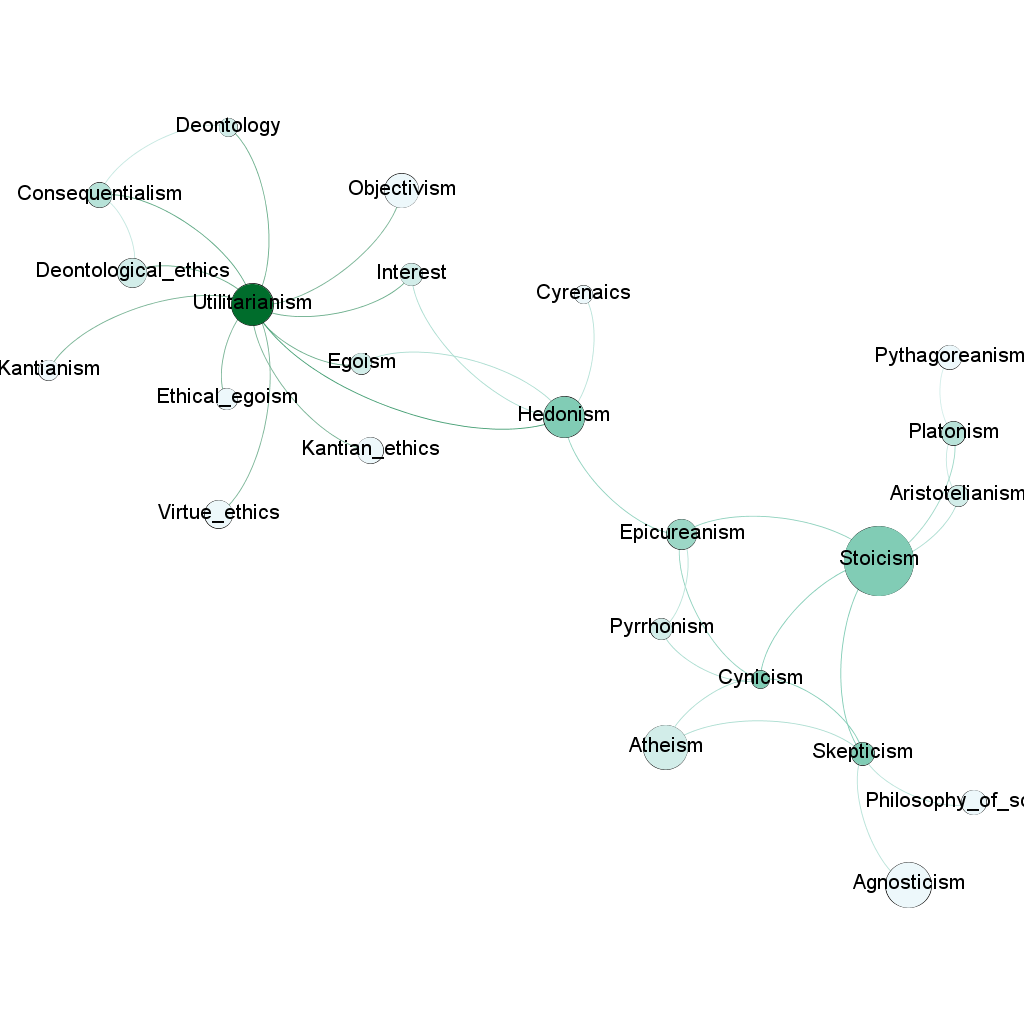
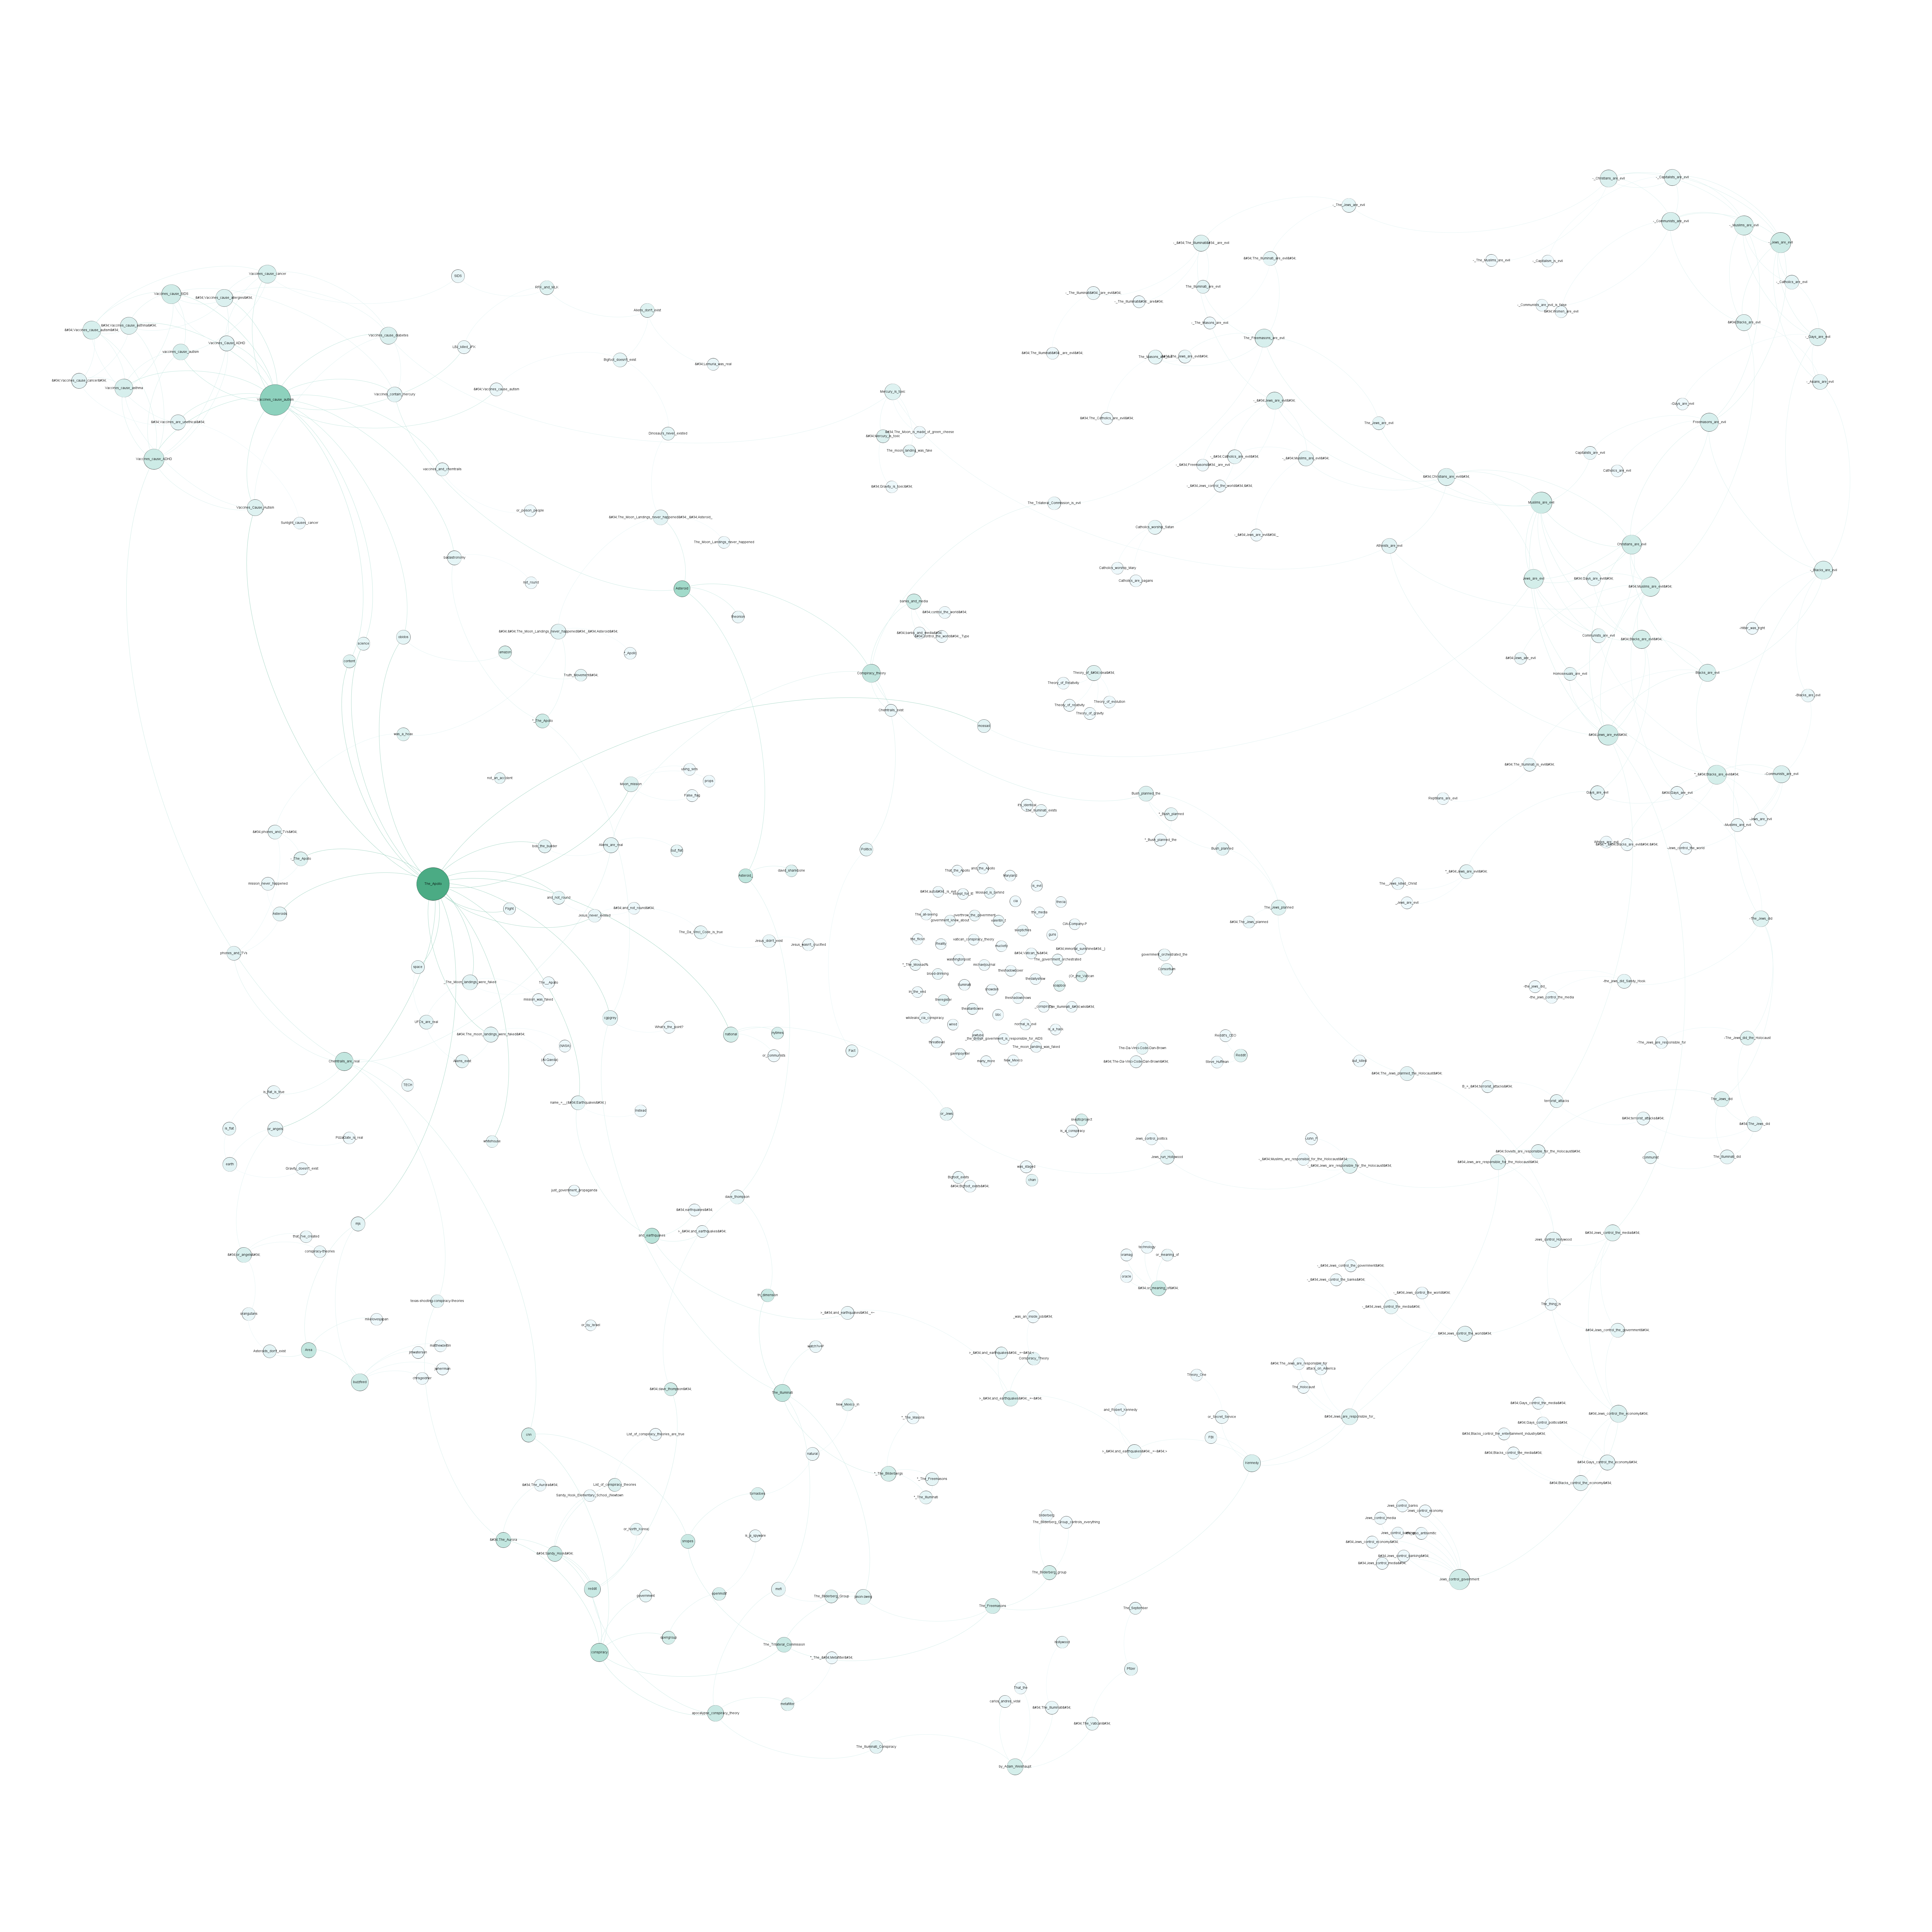
While generating content, I tweaked the conspiracy map:
Currently at 5.6M reviews ingested, and I have an interesting football and IMDB dataset to work with later
Need to integrate the DB into the interactive code
Need to clean up the interactive code so that there is a callback dispatcher that handles all the ins and outs, rather than the current multiple callbacks
Need to make a component class that keeps the html/dash elements along with names, Inputs and Outputs so that the important elements aren’t scattered all over the code
It shows Thomas De Gendt’s ride, who stayed with the main peloton (The black line), and how others diverged from that. You can see the breakaway (green line at the top), “nature breaks” (the small, sharp drops that then rise back), the attack by Bora–Hansgrohe on the final climb, the people getting dropped (then forming the autobus), and the high-speed run-in at the end of the race. It’s the whole race in a single chart.
if 'save-selected-btn' in prop_id: for i in nodes_index_list: d = self.checkbox_list[int(i)] print(d) self.seed_list.append(d['label']) # return the updated seed text, and clear out the checkboxes return ", ".join(self.seed_list), []
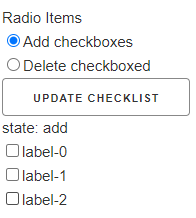
Look through the existing nodes for matches. As they are found, delete from list
Look through the remaining and create temp nodes. For each temp node, iterate over the rest of the list as above. Produce a global dictionary of name-node pairs
Produce the checklist from the names of the nodes in the dict
Add checked nodes to the graph and clear the dictionary
3:00 Meeting
Looking for other social-media-like data with ground truth, and found some interesting soccer and imdb data
Build my first good conspiracy map using the interactive map and showed it off
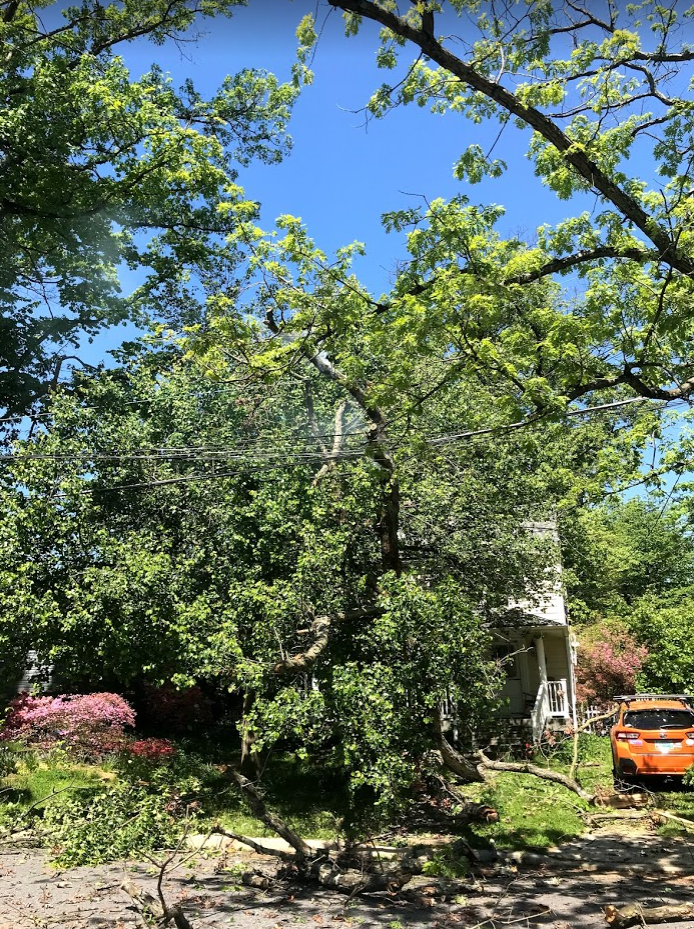
We lost power on Thursday when a tree lost a GIANT limb that fell on a power line, and took out the Verizon lines as well. I got some things back up when the power was restored, though that took longer than just turning on the house. The current spike took out some hardware, including a power strip (yay! Not the computer!), but I didn’t have a spare strip (Boo!). And Friday afternoon I was using the phone as a hotspot.
Anyway, everything’s mostly back to normal
GPT-Agents
At 4 million reviews ingested
Working in the interactive graph tool. It’s going to have to go on the back burner for a week, but I want to stub out InteractiveNode, which will handle similarity matching, links, and saving out to the DB
Built out the InteractiveNode, then spent about an hour figuring out how to do it in Plotly. There are two tricks. Selected checks are in an array. An empty array clears them out, which is handled as an output. But I also need the list of selected checks to build my graph before I clean them out, and that also triggers the callback. So I have to watch n_clicks for the button as it compares to a gloabl value. Kind of a hack, but I can’t think of anything better
def save_selected(self, n_clicks, nodes_index_list):
    if nodes_index_list == None:
        nodes_index_list = []
    if n_clicks == self.save_selected_clicks:
        return ", ".join(self.seed_list), nodes_index_list
    self.save_selected_clicks = n_clicks
    for i in nodes_index_list:
        d = self.checkbox_list[int(i)]
        print(d)
        self.seed_list.append(d['label'])
    return ", ".join(self.seed_list), []
SBIR
Got a lot of catching up to do
Write the two abstracts for the NATO conference – roughed them out and put them on Overleaf
Compute meeting. Looks like we might buy some nice hardware because IT is so wrapped up with security that we can’t develop on an AWS or Azure instance which would be much cheaper
5:30 – 7:00 Meeting with Andreea. We talked about a lot, but the idea of training a Transformer to translate between English and Maori-English slang seems particularly interesting. Also some exploration about how the GPT-3 might afford some insight into perceptions about this. Here’s an example (prompt is in bold)
Vision Mātauranga is polarizing because it is both radical and conservative. Both the radical part and the conservative part are necessary for mana motuhake. The radical part is about opening up to new ideas, new ways of seeing things, rejecting old ideas and systems that are no longer relevant to our needs and ways of living. The conservative part is about having the humility to keep the things that work, that are relevant, that are meaningful. We need to be able to accept that there are many ways of knowing and understanding the world, and we (as Māori) have our own way of knowing and understanding the world.
Normally, I’d be doing my plots of COVID deaths for the month of April, but the disease is now working its way through countries that are not accurately reporting counts. I heard today on the BBC that India’s counts could be 2-8 times higher than reported.
After making a bunch of maps yesterday, and in particular, struggling with the conspiracy theory map that has no useful Wikipedia ground truth to eliminate cruft, I realize I’m going to have to build a more interactive tool. It should be useful for other things, like Antonio’s concept mapper. It can also support multiple prompts, like
“A short list of {}”
“A short list of {} that are similar to {}”
“A short list of the elements that make up {}”
The human chooses the nodes that make sense, and intermediate networks are drawn at each pass through the results. The exit is manual, and writing out a gml file can happen at any time
Going to try Plotly for this. If I can make dynamic lists of checkboxes, then I should be ok, otherwise TKinter
Making progress with Plotly!
Dynamically adding checkboxes!
Got everything working! Going to make it a class now
5:00 Meeting
SBIR
9:15 Standup
Meet with Rukan after to see how things are going
Create final report template with material from previous reports
Set up meeting with Clay to discuss commercialization strategy
This survey explores how Deep Learning has battled the COVID-19 pandemic and provides directions for future research on COVID-19. We cover Deep Learning applications in Natural Language Processing, Computer Vision, Life Sciences, and Epidemiology. We describe how each of these applications vary with the availability of big data and how learning tasks are constructed. We begin by evaluating the current state of Deep Learning and conclude with key limitations of Deep Learning for COVID-19 applications. These limitations include Interpretability, Generalization Metrics, Learning from Limited Labeled Data, and Data Privacy. Natural Language Processing applications include mining COVID-19 research for Information Retrieval and Question Answering, as well as Misinformation Detection, and Public Sentiment Analysis. Computer Vision applications cover Medical Image Analysis, Ambient Intelligence, and Vision-based Robotics. Within Life Sciences, our survey looks at how Deep Learning can be applied to Precision Diagnostics, Protein Structure Prediction, and Drug Repurposing. Deep Learning has additionally been utilized in Spread Forecasting for Epidemiology. Our literature review has found many examples of Deep Learning systems to fight COVID-19. We hope that this survey will help accelerate the use of Deep Learning for COVID-19 research.
Word embeddings are a powerful machine-learning framework that represents each English word by a vector. The geometric relationship between these vectors captures meaningful semantic relationships between the corresponding words. In this paper, we develop a framework to demonstrate how the temporal dynamics of the embedding helps to quantify changes in stereotypes and attitudes toward women and ethnic minorities in the 20th and 21st centuries in the United States. We integrate word embeddings trained on 100 y of text data with the US Census to show that changes in the embedding track closely with demographic and occupation shifts over time. The embedding captures societal shifts—e.g., the women’s movement in the 1960s and Asian immigration into the United States—and also illuminates how specific adjectives and occupations became more closely associated with certain populations over time. Our framework for temporal analysis of word embedding opens up a fruitful intersection between machine learning and quantitative social science
More work with Rukan. We’re going to focus on some simple spikes
The simple spikes look great. We’re going to do a sensitivity analysis on the MDS data now
Got my fancy query working
create or replace view view_combined as
    select distinct e.id, e.name, e.description, s1.value as dimension_size, s2.value as layers,
                    r1.value as avg_cos_loss, r2.value as avg_l1_loss from
        table_experiment e
            join table_settings s1 on e.id = s1.experiment_id and s1.name = 'dimension_size'
            join table_settings s2 on e.id = s2.experiment_id and s2.name = 'layers'
            join table_results r1 on e.id = r1.experiment_id and r1.name = 'avg cosine loss'
            join table_results r2 on e.id = r2.experiment_id and r2.name = 'avg l1 loss';
select * from view_combined where id = 100;
9:15 status meeting. It looks like I’ll be working on the phase 2 proposal for the rest of the week?
8:45 pre-standup with Rukan to see how things are going
Looks like we are going to improve our experiment pipeline since we seem to be loosing data. Rukan is looking into what it takes to get MySql installed on his instance
Working to identify bias in the data and mitigate bias in the system
A list of countries that share a border with {}, separated by commas
I still haven’t entirely fixed my UTF 8 problem
Start writing up something about the belief maps to add to the chess paper, and maybe as an overall article
Country counts (150 vs 195 with no false positives, excluding six prompt countries, 76% coverage) Missing countries include Guadalupe, Guyana, Israel, Jordan, Lebanon, Madagascar, Liberia, Micronesia, Niger, Paraguay, Senegal, Sri Lanka, Tunisia, Uruguay, Venezuela, and Yemen
10:00 Meeting with Antonio. Nice discussion on moving forward. He suggests using the mapper to create a meta-knowledge graphing tool that works along the lines of the Third Author approach, where an expert can influence and interactively edit the creation of the maps
Worked on my UTF-8 problem, but it’s still not fixed
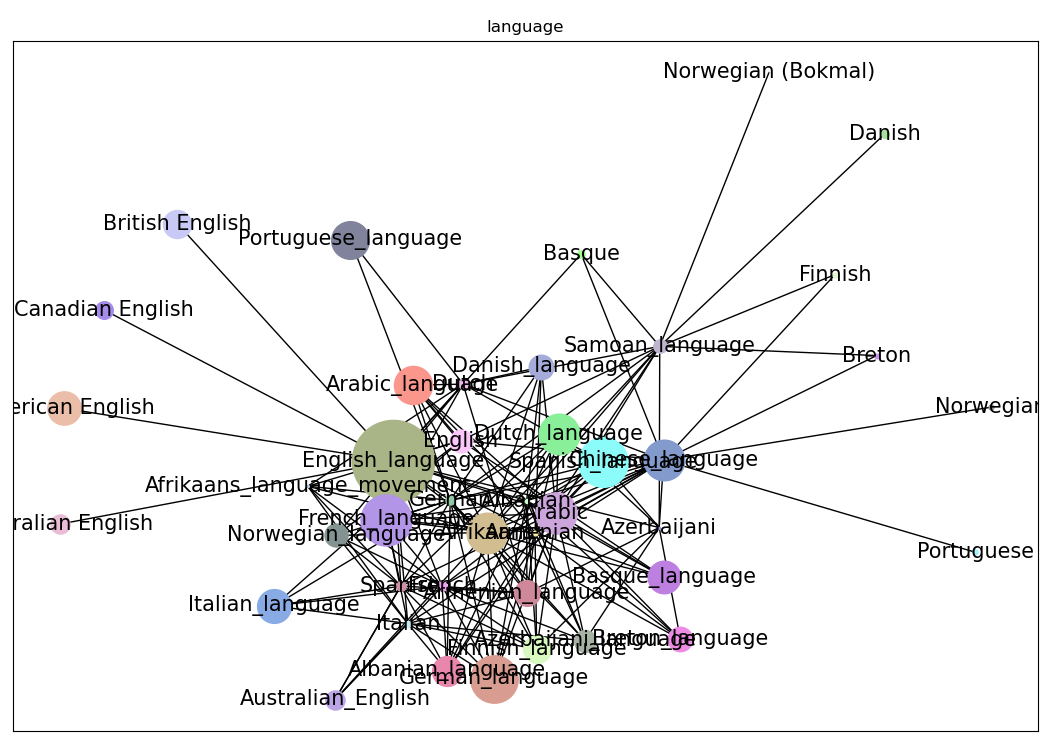
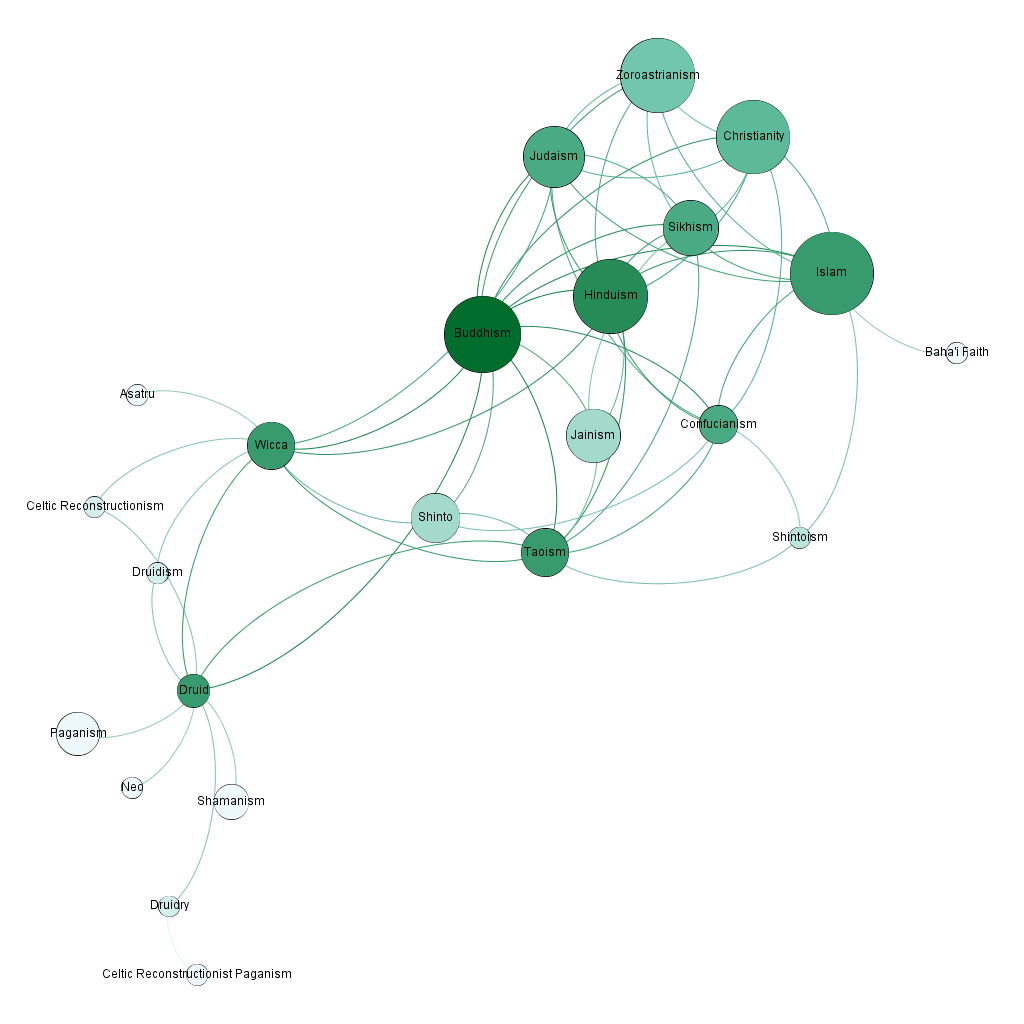
"A short list of the religions that are closest to {}:"
working with the model. There are more varied responses, so the parsing is a little more complex. The way that I’m currently working is by having the model return ten (rather than 3) responses that I then organize:
The first element is to look for a similar Wikipedia page, which is done as follows:
I think for the time being, I’ll just pull the first one (closest_list[0]) and see what that looks like, though I could also use all close matches or the one with the largest page views
Rolling all the changes into GraphToDB. Urk.
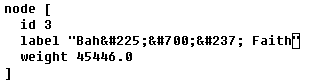
I had to tweak out some junk text (maybe UTF-8 issues?) Here’s an example: = “Baháʼí Faith” is being rendered as
Went nowhere. More than anything, this reminded me of a Defense with a hostile faculty lobbing hand grenades. In my list of management types, this guy was an assassin/power broker
GPT Agents
Got a ping from Ashwag on her team’s work, which was nice
Did some cleanup editing on the paper
Work on religion map if I get all the SBIR work done in time. Nope – tomorrow
Spent some time this morning adjusting the code so that experiment-specific regexes can be created and stored in the db. Also played around some with trying to figure out how to choose the best Wikipedia page(s?)
SBIR
Working on the status report. Mostly done. Need to do the summary paragraph
2:00 weekly meeting. Asked Peter and Loren to supply content by COB Thursday


You must be logged in to post a comment.