DataFormat interface and example:
export interface IChartElementFormat {
   label:string;
   objectName:string;
   type:string; // "area", "bar", pie, cluster
   hexColor:number;
}

export interface IChartFormat{
   [label:string]:IChartElementFormat;
}

this.dataFormat = { // might add 2D/3d, dynamic/static, etc.
   goals: {label:"Goals", objectName:"goals", type:"area", hexColor:0xFF0000},
   obligations:{label:"Obligations", objectName:"obligations",  type:"area",hexColor:0xFFFF00},
   pm_actuals:{label:"PM Actuals", objectName:"pm_actuals",  type:"bar",hexColor:0x00FF00},
   facts:{label:"Facts", objectName:"facts",  type:"bar",hexColor:0x0000FF},
   future_pm_actuals:{label:"Future PMA", objectName:"future_pm_actuals",  type:"area",hexColor:0xAAFFAA},
   future_facts:{label:"Future FACTS", objectName:"future_facts",  type:"area", hexColor:0xAAAAFF}
};
DataProvider example:
this.dataProvider = {
type:'XY', // RAH (Radius Angle Height) RAE (Radius Azimuth Elevation), XYZ, etc.
min_max:{xmin:0.00, xmax:11.00, ymin:0.00, ymax:3715.30},
mappings:[{Jan:0, Feb:1, Mar:2, Apr:3, May:4, Jun:5, Jul:6, Aug:7, Sep:8, Oct:9, Nov:10, Dec:11}],
data:{
goals: {
Jan: {min: 0, max: 1000.00},
Feb: {min: 0, max: 1100.00},
Mar: {min: 0, max: 1210.00},
Apr: {min: 0, max: 1331.00},
May: {min: 0, max: 1464.10},
Jun: {min: 0, max: 1610.51},
Jul: {min: 0, max: 1771.56},
Aug: {min: 0, max: 1948.72},
Sep: {min: 0, max: 2143.59},
Oct: {min: 0, max: 2357.95},
Nov: {min: 0, max: 2593.74},
Dec: {min: 0, max: 2853.12}
},
obligations: {
Jan: {min: 0, max: 500.00},
Feb: {min: 0, max: 600.00},
Mar: {min: 0, max: 720.00},
Apr: {min: 0, max: 864.00},
May: {min: 0, max: 1036.80},
Jun: {min: 0, max: 1244.16},
Jul: {min: 0, max: 1492.99},
Aug: {min: 0, max: 1791.59},
Sep: {min: 0, max: 2149.91},
Oct: {min: 0, max: 2579.89},
Nov: {min: 0, max: 3095.87},
Dec: {min: 0, max: 3715.04}
},
pm_actuals: {
Jan: {min: 0, max: 250.00},
Feb: {min: 0, max: 341.39},
Mar: {min: 0, max: 495.27},
Apr: {min: 0, max: 618.30},
May: {min: 0, max: 923.08},
Jun: {min: 0, max: 1318.68}
},
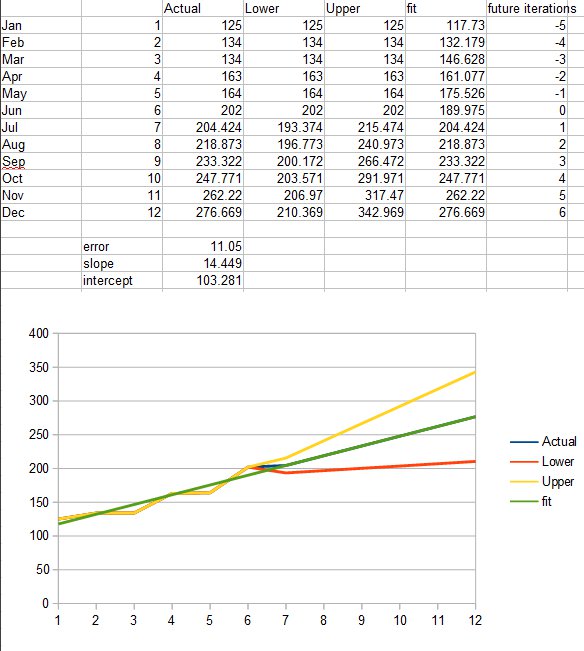
facts: {
Jan: {min: 0, max: 125.00},
Feb: {min: 0, max: 134.17},
Mar: {min: 0, max: 134.31},
Apr: {min: 0, max: 163.00},
May: {min: 0, max: 164.36},
Jun: {min: 0, max: 202.29}
},
future_pm_actuals: {
Jun: {min: 1318.68, max: 1318.68},
Jul: {min: 1257.91, max: 1499.96},
Aug: {min: 1342.92, max: 1827.03},
Sep: {min: 1427.94, max: 2154.10},
Oct: {min: 1512.96, max: 2481.16},
Nov: {min: 1597.97, max: 2808.23},
Dec: {min: 1682.99, max: 3135.30}
},
future_facts: {
Jun: {min: 202.29, max: 202.29},
Jul: {min: 193.38, max: 215.48},
Aug: {min: 196.77, max: 240.99},
Sep: {min: 200.17, max: 266.49},
Oct: {min: 203.57, max: 291.99},
Nov: {min: 206.96, max: 317.50},
Dec: {min: 210.36, max: 343.00}
}
}
};


You must be logged in to post a comment.