Diversity injection example:

Book – working through the mapping section

Diversity injection example:
Book – working through the mapping section
There is something really deep in that kind of thinking. It would be a micro stampede for sure. Could the AI herd the person into a harmless area? Would that be ethical?
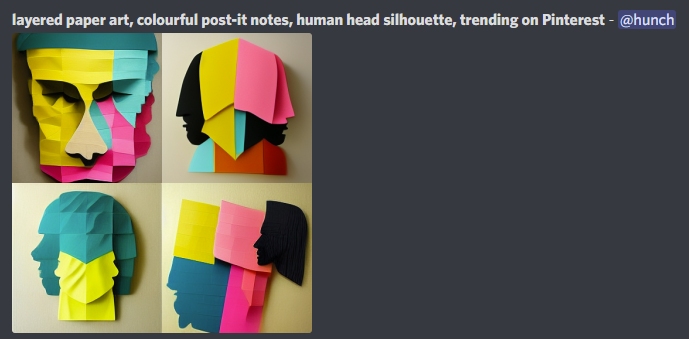
Depolarization of echo chambers by random dynamical nudge
SBIRs
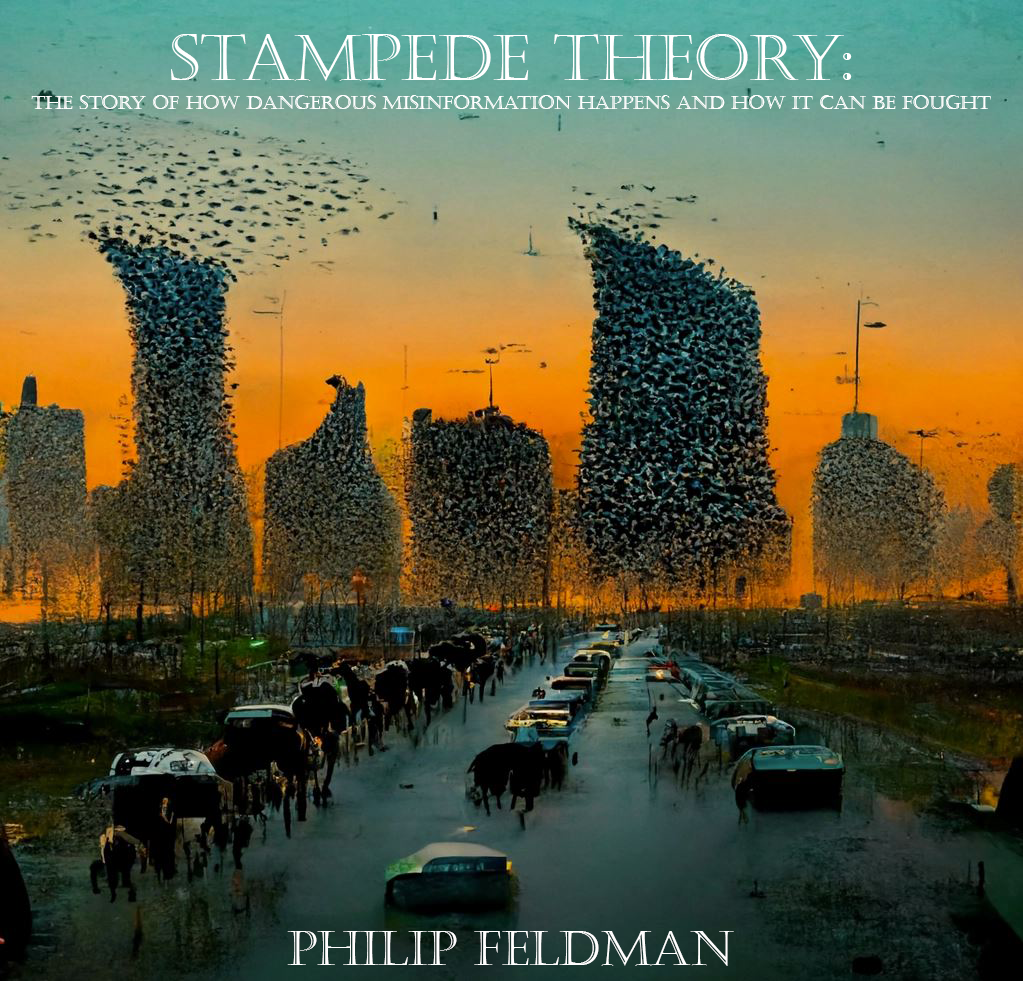
Book
SBIRs
GPT Agents
Call Barbara after 10:00
Book
SBIRs
GPT Agents

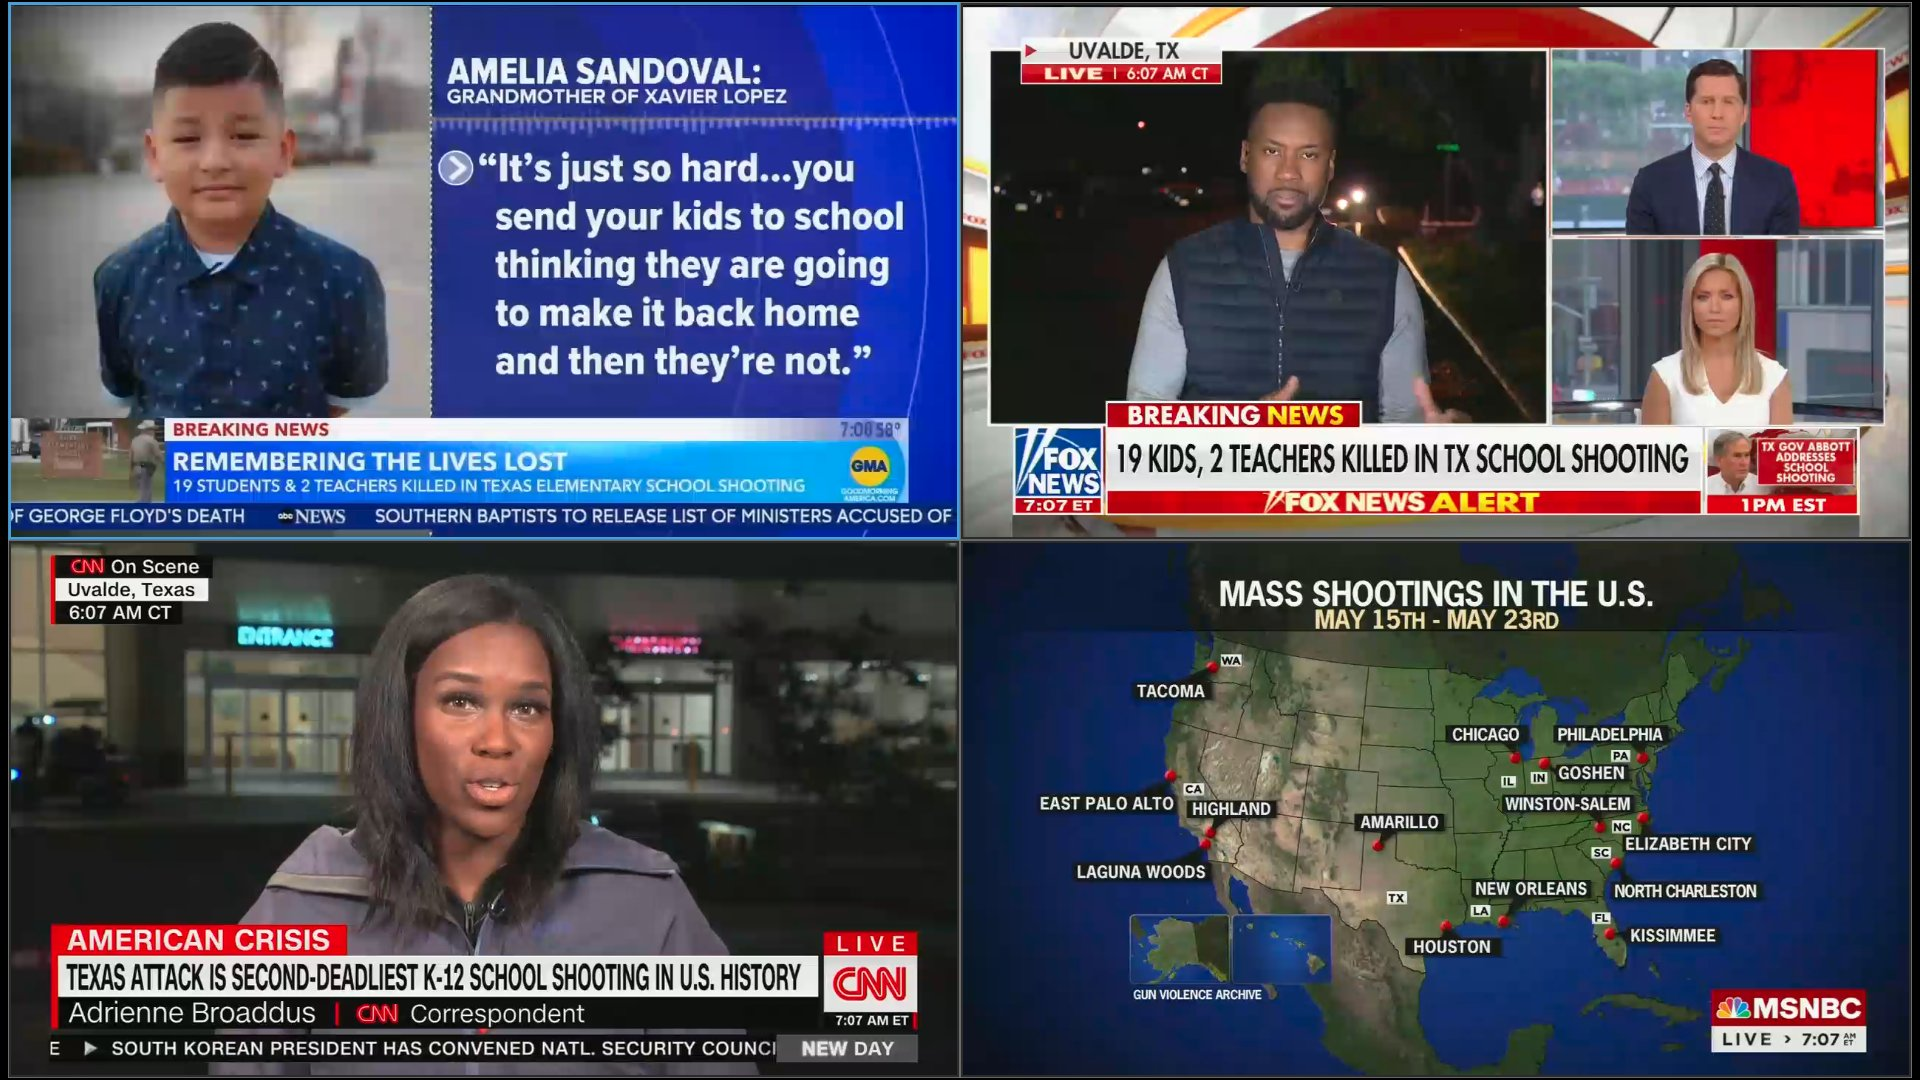
My contribution to the mass shooting discussion. Let’s try placing taxes on 2nd amendment products (guns, ammo, etc.) based on the number killed and wounded in the last, say, 100 days. For each person (or child) killed, add 10% each, and for each person (or child) wounded add 5% maybe? Seems reasonable, no? If no one is killed or injured in a mass shooting in the last 100 days, no taxes! Just leave it up to the manufacturers and gun owners to decide what they need to do to keep their taxes down. After all, they keep telling us they understand the problem better than anyone.
Maybe we use the proceeds for funding free mental healthcare for all? After all, that’s the current excuse for gun violence.
What would that look like? Well, using the handy list of mass shootings in the USA in 2022, we can work this out:
I think the problem would be fixed. Probably within 100 days. No other laws required.
Book
SBIRs
GPT-Agents
Exposing the fetish of right-wing politics and how liberals can fight back
SBIRs
Book
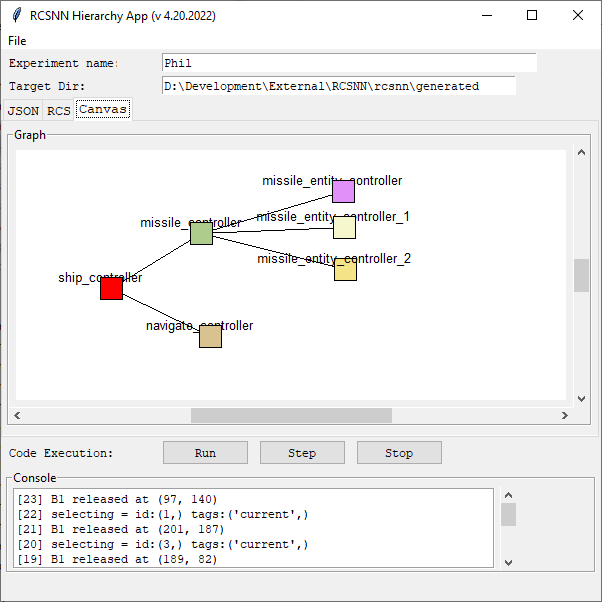
Need to write some code that lets me play with a bullet tax based on this insanity
GPT Agents

Book
SBIRs

SBIRs
GPT agents
Book
Waikato
Just finished up a nice bike vacation:

And I got a chapter cleaned up in the book! Need to photoshop a few pix
Simple Annotated implementation of GPT-NeoX in PyTorch
SBIRs
Book
Waikato
Book
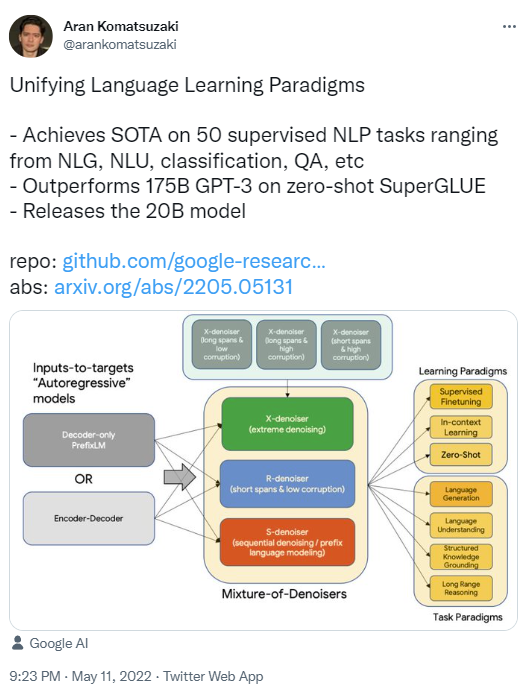
New UL2 model

Book
SBIRs
Book
SBIRs


Inferring strategies from observations in long iterated Prisoner’s dilemma experiments
Book
SBIRs
GPT Agents
Found this today: transdiffusion.org: Founded in 1964, Transdiffusion’s huge archive of television and radio material is provided free to people wishing to learn more about the history of broadcasting in the UK
Book
SBIRs

You must be logged in to post a comment.