
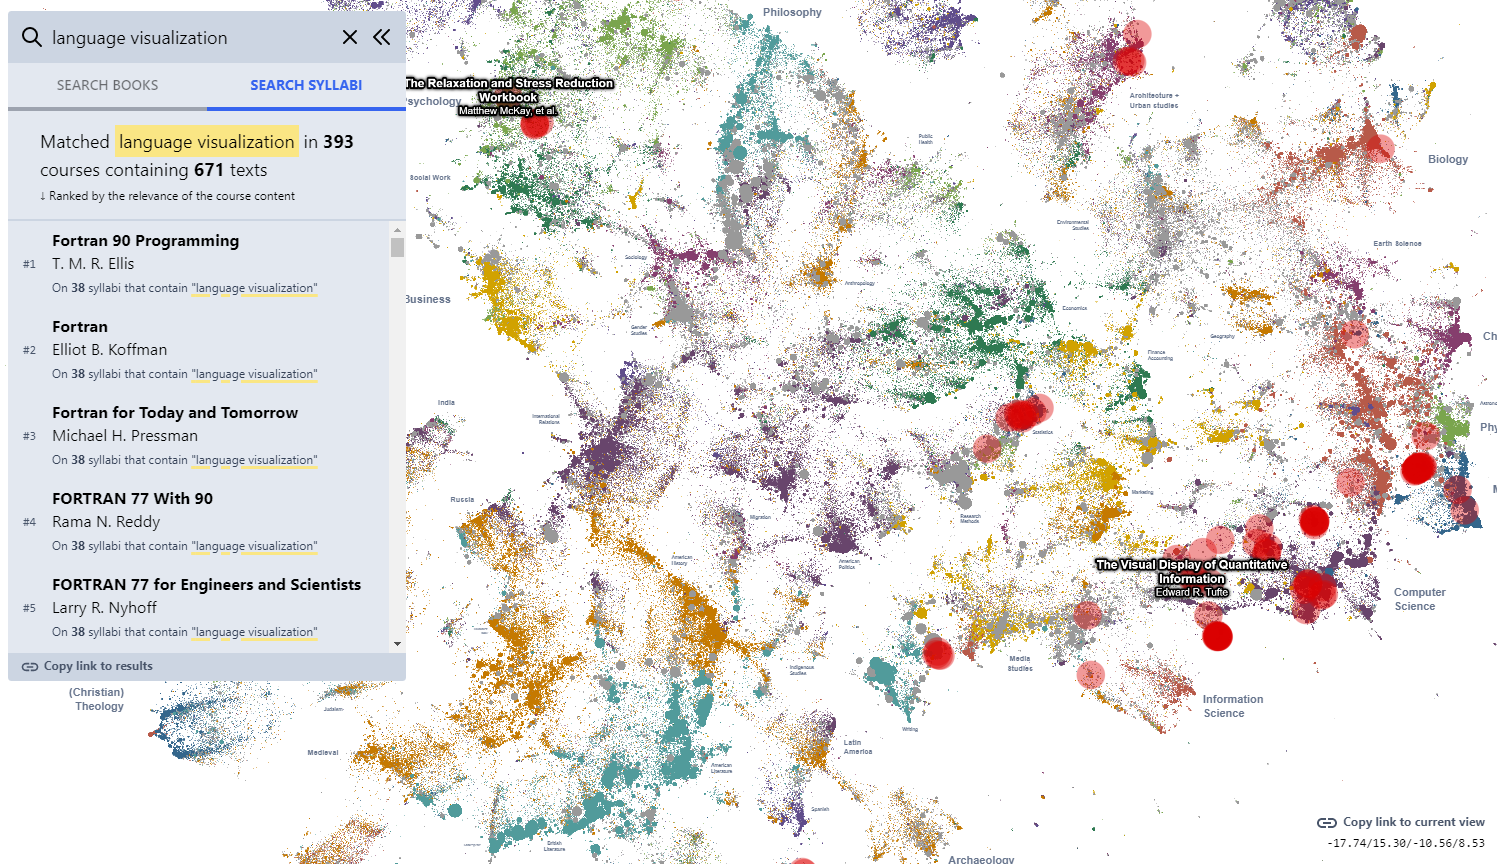
Today we’re excited to release a big update to the Galaxy visualization, an interactive UMAP plot of graph embeddings of books and articles assigned in the Open Syllabus corpus! (This is using the new v2.5 release of the underlying dataset, which also comes out today.) The Galaxy is an attempt to give a 10,000-meter view of the “co-assignment” patterns in the OS data – basically, which books and articles are assigned together in the same courses. By training node embeddings on the citation graph formed from (syllabus, book/article) edges, we can get really high-quality representations of books and articles that capture the ways in which professional instructors use them in the classroom – the types of courses they’re assigned in, the other books they’re paired with, etc.
Working with Antonio on an introduction to the journal
GPT Agents
- Was going to work on adding local models to Ecco, but got derailed
- GPT-3: Language Models are Few-Shot Learners (Paper Explained)
- Downloaded Sim’s new model
- Uploaded/committed the zipped backup
- Run Sim’s Queries and add to spreadsheet (need to create a view that uses text from extended tweet if available):
#to get week number (in range 0-53 ) from date
select count(*) as COUNT, extract(WEEK from created_at) as WEEK from twitter_root where text like “%chinavirus%” group by extract(WEEK from created_at) order by extract(WEEK from created_at);
#to drill down from month to week and week to day for March and April since they have significantly larger volume of data
select count(*) as COUNT, date(created_at) as DATE from twitter_root where text like “%chinavirus%” and (month(created_at) = 3 or month(created_at) = 4) and year(created_at) = 2020 group by date(created_at) order by date(created_at);
Figured out how to do this:
create or replace  view long_text_view as
select tr.row_id, tr.created_at,
    case when extended_tweet_row_id <> 0 then et.full_text else tr.text end as long_text
    from twitter_root tr
        left join extended_tweet et on tr.extended_tweet_row_id = et.row_id;
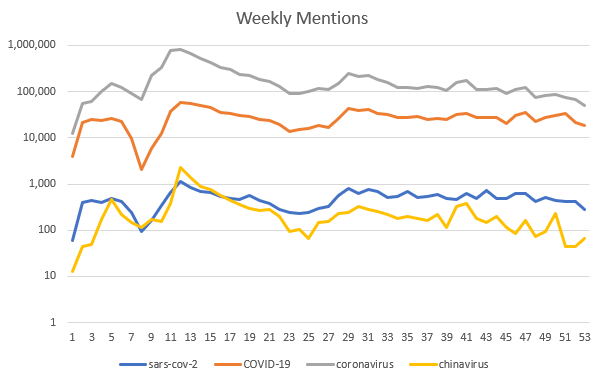
This is kind of cool. The chinavirus is most peaky but low volume. The sars-cov-2 is low volume but flatter, and the more common terms are pretty similar with gentler peaks and slower falloff. I want to know what that dip isaround week nine, and the peak at week 5 in the chinavirus plot.
GOES
- Time to really dig into transformers
- http://peterbloem.nl/blog/transformers – for converting a sequence to sequence into a classifier. The videos are very nice!
- https://datascience.stackexchange.com/questions/51065/what-is-the-positional-encoding-in-the-transformer-model – Positional Encoding, the terms were a bit vague in some other articles
- http://jalammar.github.io/illustrated-transformer/ – For Attention Heads
SBIR
- 10:00 Meeting
