
Well, I’ve got more predictions using death rates as described in this post. Based on the latest dataset from here (Github), I’ve created a spreadsheet that does a linear (least squares) extrapolation for when the number of new deaths per day drops to zero:
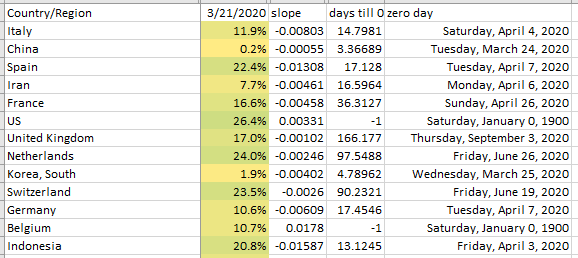
China is in this group as a sanity check, and as you can see, it’s very near zero, and so is South Korea. Italy, Germany, Spain, Iran, and Indonesia are currently all in the middle, with 2-3 weeks to go if nothing changes. France, the Netherlands, and Switzerland are far enough out that I think these may be low confinance values. The UK seems to be doing terribly. The worst performers are Belgium and the US, whose death rates are still going up, as indicated by the “-1” in the “days till” column.
Here are plots of the data used to calculate the table. Due to the way that excel labels axis, I don’t have dates for the x-axis for all the charts. They all end on the seme date (3/21, the last day in the dataset with the two days I need to calculate rates), but some of them have fewer tata points so that the time before the outbreak doesn’t influence the calculations:

Working on Hours for misinfo proposal
ASRC
- Had a good chat with Biruh about InfluxDB running in Docker. Since I’m running the Windows version, things are different enough that I’m going to need to download a linux distro image and run my own version of InfluxDB2 inside that. Which means I need to get smarter on Docker and making a custom image, etc. Got this book. We’ll see how that goes today.
ML Webex meeting
BART is the new BERT!

