Monthly Archives: May 2016

Phil 5.6.16

7:00 – 4:00 VTX

  • Today’s shower thought is to compare the variance of the difference of two (unitized) rank matrices. The maximum difference would be (matrix size), so we do have a scale. If we assume a binomial distribution (there are many ways to be slightly different, only two ways to be completely different), then we can use a binomial (one tailed?) distribution centered on zero and ending at (matrix size). That should mean that I can see how far one item is from the other? But it will be withing the context of a larger distribution (all zeros vs all ones)…
  • Before going down that rabbit hole, I decided to use the bootstrap method just to see if the concept works. It looks mostly good.
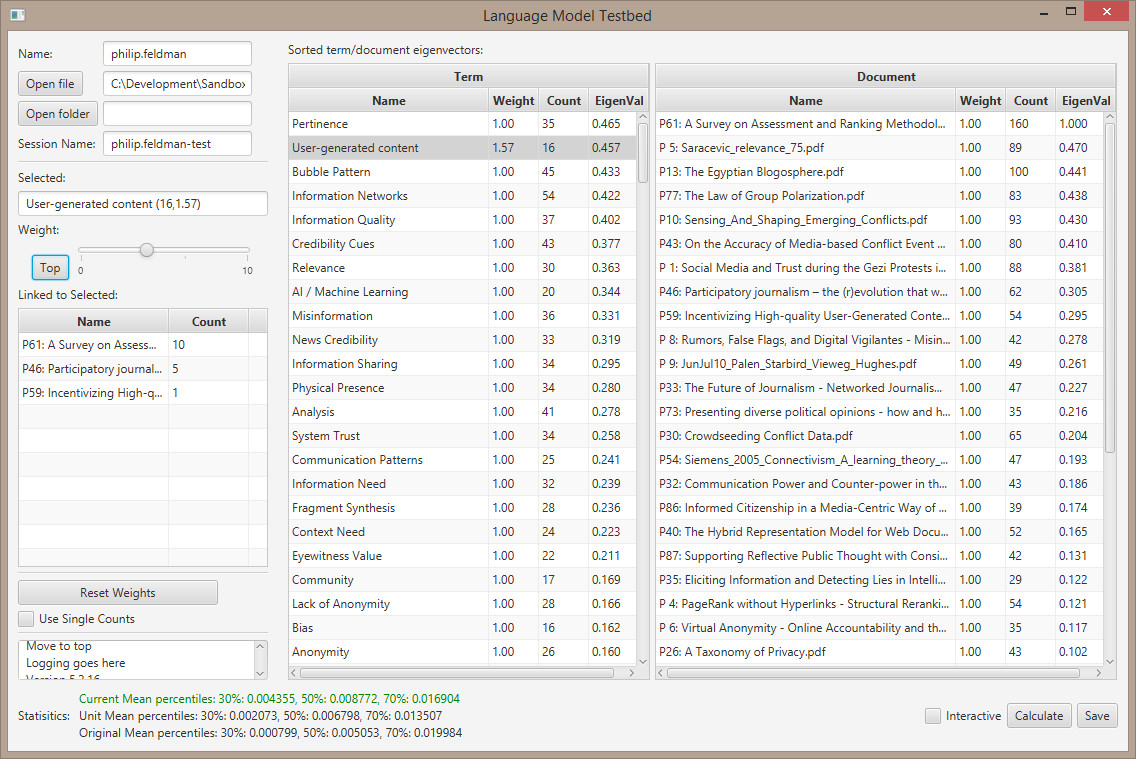
    • Verified that scaling a low-ranked item (ACLED) by 10 has less impact than scaling the highest ranking item (P61) by 1.28.
    • Set the stats text to red if it’s outside 1 SD and green if it’s within.
    • I think the terms can be played around with more because the top one (Pertinence) gets ranked at .436, while P61 has a rank of 1.
    • There are some weird issues with the way the matrix recalculates. Some states are statistically similar to others. I think I can do something with the thoughts above, but later.
  • There seems to be a bug calculating the current mean when compared to the unit mean. It may be that the values are so small? It’s occasional….
  • Got the ‘top’ button working.
  • And that’s it for the week…

LMT With Data2

Oh yeah – Everything You Ever Wanted To Know About Motorcycle Safety Gear

Phil 5.5.16

7:00 – 5:30 VTX

  • Continuing An Introduction to the Bootstrap.
  • This helped a lot. I hope it’s right…
  • Had a thought about how to build the Bootstrap class. Build it using RealVector and then use Interface RealVectorPreservingVisitor to do whatever calculation is desired. Default methods for Mean, Median, Variance and StdDev. It will probably need arguments for max iteration and epsilon.
  • Didn’t do that at all. Wound up using ArrayRealVector for the population and Percentile to hold the mean and variance values. I can add something else later
  • I think to capture how the centrality affects the makeup of the data in a matrix. I think it makes sense to use the normalized eigenvector to multiply the counts in the initial matrix and submit that population (the whole matrix) to the Bootstrap
  • Meeting with Wayne? Need to finish tool updates though.
  • Got bogged down in understanding the Percentile class and how binomial distributions work.
  • Built and then fixed a copy ctor for Labled2DMatrix.
  • Testing. It looks ok, but I want to try multiplying the counts by the eigenVec. Tomorrow.

Phil 5.4.16

7:00 – 5:30

  • Had a thought about looking at the difference of a re-weighted networks and the ‘original’ network. If the reweighted network is say, 95% similar to the original, then the re-weighting can be considered not to be significant and can therefore be read as a viable hypothesis. If, on the other hand, the difference is greater than that, then the degree of difference is an indication of how poor the match of the concepts(?) vs the data is.
  • And with that in mind, starting on An Introduction to the Bootstrap. Here’s hoping it’s readable… So far, so good. Made it through chapter one understanding most(?) things?

  • Added exponential mapping for weight slider

  • Commented out the lines that changed the weight in the docList and termList. And added them back in if the ‘use single counts is being changed.
  • Added the ‘top’ button. Need to implement
  • Adding a simple difference calculation
  • Figured out most of bootstrap in Excel.
  • Sprint planning.

Phil 5.3.16

7:00 – 3:30 VTX

  • Out riding, I realized that I could have a column called ‘counts’ that would add up the total number of ‘terms per document’ and ‘documents per terms ‘. Unitizing the values would then show the number of unique terms per document. That’s useful, I think.
  • Helena pointed to an interesting CHI 2016 site. This is sort of the other side of extracting pertinence from relevant data. I wonder where they got their data from?
    • Found it!. It’s in a public set of Google docs, in XML and JSON formats. I found it by looking at the GitHub home page. In the example code  there was this structure:
      source: {
          gdocId: '0Ai6LdDWgaqgNdG1WX29BanYzRHU4VHpDUTNPX3JLaUE',
          tables: "Presidents"
        }

      That gave me a hint of what to look for in the document source of the demo, where I found this:

      var urlBase = 'https://ca480fa8cd553f048c65766cc0d0f07f93f6fe2f.googledrive.com/host/0By6LdDWgaqgNfmpDajZMdHMtU3FWTEkzZW9LTndWdFg0Qk9MNzd0ZW9mcjA4aUJlV0p1Zk0/CHI2016/';
      

      And that’s the link from above.

    • There appear to be other useful data sets as well. For example, there is an extensive CHI paper database sitting behind this demo.
    • So this makes generalizing the PageRank approach much more simple since it looks like I can pull the data down pretty simply. In my case I think the best thing would be to write small apps that pull down the data and build Excel spreadsheets that are read in by the tool for now.
  • Exporting a new data set from Atlas. Done and committed. I need to do runs before meeting with Wayne.
  • Added Counts in and refactored a bit.
  • I think I want a list of what a doc or term is directly linked to and the number of references. Addid the basics. Wiring up next. Done! But now I want to click on an item in the counts list and have it be selected? Or at least highlighted?
  • Stored the new version on dropbox: https://www.dropbox.com/s/92err4z2posuaa1/LMN.zip?dl=0
  • Meeting with Wayne
    • There’s some bug with counts. Add it to the WeightedItem.toString() and test.
    • Add a ‘move to top’ button near the weight slider that adds just enough weight to move the item to the top of the list. This could be iterative?
    • Add code that compares the population of ranks with the population of scaled ranks. Maybe bootstrapping? Apache Commons Math has KolmogorovSmirnovTest, which has public double kolmogorovSmirnovTest(double[] x, double[] y, boolean strict), which looks promising.
  • Added ability to log out of the rating app.

Phil 5.2.16

7:00 – 3:00 VTX

  • How to get funding using Web of Science
  • http://www.grants.gov/web/grants/search-grants.html
  • http://www.research.gov/
  • Finished  Supporting Reflective Public Thought with ConsiderIt
    • Watched the ConsiderIt demo. I love the histogram that shows how the issue polarization is characterized.
  • Back to  Informed Citizenship in a Media-Centric Way of Life
    • Page 225 – Conclusions: As prescriptive as it may sound, it is time to suspend the normative traditions that envelop journalism and democracy, take stock of how knowledge is explicated and operationalized, and calibrate research practice to accommodate an explication of informed citizenship and democratic participation itted to contemporary life. Doing so strays from the dominant research paradigm, grounded in convictions about the supremacy of rational thought, verbal information, news as cold hard facts, and electoral activities as the gold standard of participatory practices. We advanced arguments for a departure from tradition and elaborated on how the very notions of informed citizenship and political participation are mutating in (and because of) the current media environment.
    • And this is kind of scary: Freedom is on the longest global downward trajectory in 40 years (Freedom House, 2011), democratic failure is at the highest rate since the mid-1980s (Diamond, 1999), and there are indicators of qualitative erosion in democratic practice worldwide (Bertelsmann Foundation, 2012). he people’s view on democratic life appears tepid, in several parts of the world, there are reports of a so-called authoritarial nostalgia among citizens who live in Asian countries that are transforming to democratic systems of governance (Chang, Chu, & Park, 2007) while a mere half (or fewer) of Russians, Poles, Ukrainians, and Indonesians expressed strong support for democratic rule (World Public Opinion.org, 2015).
      • Make America Great Again.
    • Done. Reading this makes me feel more like a connectivist/AI revolution is coming that will either tend towards isolating us more or finding ways to bring us together. The thing is that we’re wired to do both. So this really is a design problem.
  • ————————————
  • Well drat, was going to do some light work on developing the ranking app, but it looks like I forgot to check in the latest version of Java Utils
  • Installed Launch4j
  • TODO:
    • Add a ‘session name’ text field – done
    • Add a ‘interactive’ checkbox. If it’s selected, then change in the weight slider will fire calculate(). Done
    • Fixed the ‘Reset Weights’
    • Got the ‘Use Unit Weights’ option. I just replace all the non-zero values in the derived symmetric matrix to 1.0. I have a suspicion that this will come back to bite me, but for now I can’t think of a reason. The only thing that I really don’t like is that there is no obvious change in the data. The ‘Weights’ column actually means ‘scalar’. This issue is that the whole matrix would have to be shown, since the weight exists at the intersection of two items. So a row or column is sort of a sum of weights.
    • Start TF-IDF app. It should do the following:
      • Take a list of URIs (local or remote, pdf, html, text). These are the documents
      • Read each of the documents into a data structure that has
        • Document title
        • Keywords (if called out)
        • Word list (lemmatized)
          • Word
          • Document count
          • Parts Of Speech(?)
      • Run TF-IDF to produce an ordered list of terms
      • Build a co-occurrence matrix of terms and documents
      • Output matrix to Excel.
  • The end of a good day:

LMT With Data

Phil 5.1.16

  • I have Supporting Reflective Public Thought with ConsiderIt for homework, but it’s worth adding to the Lit review
    • ConsiderIt is still around. It’s looking pretty nice, actually. Not much in the way of backlinks though (https___consider).
    • I like the inclusion of Nudge Theory. It’s an important point that design that affects masses of people has to take this basic consideration to heart. I contend that nudging is happening now, towards fragmentation and Group Polarization. The forces that drive advertising (and through association, content) to ever more targeted audiences means that each of these audiences can be nudged in different directions without knowing that they are even part of the group that is polarizing.