
- deployed new FR
- modified project_names table with new data
- Lenny’s request
increase WIDTH of SELECTadd optional field for Project Lab PM to behave like Project Lab – When Other is selected show manual entry.
- added cg-busy to charting-data
- back to the charting app….
Phil 5.20.15
7:30 – 4:00 SR
- DB backups
- Deploy new FR code
- Changed project names
- Work on 3D chart
Dong Shin 05.18.2015
- going through FR
- added scope.$watch() function in currencyInput directive to catch values set outside – automatic 100%
- must initialize the validators to true as multiple false validators show up
Dong Shin 05.15.2015
- finally got directive to work with multiple validators and a currency filter!
- new directive has broken lots of things (calculations), going thru FR to fix….
Phil 5.15.15
7:30 – 4:00 SR
- Backups
- Tried ‘compress’, which seemed to compress the files in-place. It did not put them in a zip file. Going to try gnu utilities next.
- Lenny says all the funds are dispersed in CONUS. Need a globe and planar charting. Basically the difference should be AZ/EL vs X/Y
- Migrating the generic chart data classes/interfaces to WebGlChartData
- had to cast an array index from string to <any>. Don’t know why:
export class ChartInfo extends NovettaUtils.ATSBase{ public cSeries:CartesianSeries[]; constructor() { this.cSeries = []; } public addSeries (key:string, source:WglChartData.IChartDataElement):void { var cs:CartesianSeries = new CartesianSeries(key, source); cs.mapData(this.minVec, this.maxVec); this.cSeries[<any>key] = cs; // <----------- why?????? } } - Added a dataprovider and dataformat to WGLA_controller2 and started passing data into Wgl3dCharts. Individual elements with their mappings are coming across correctly. Next comes the actual mapping.
Dong Shin 05.14.2015
- Lenny didn’t have the projects list ready
- more directives for Obligations/Outlays in FR
Phil 5/14/15
8:00 – 4:30 SR
- Backups. Starting to zip them before storing them because they compress so well. Need to add that to the script. Looks like we use compact.
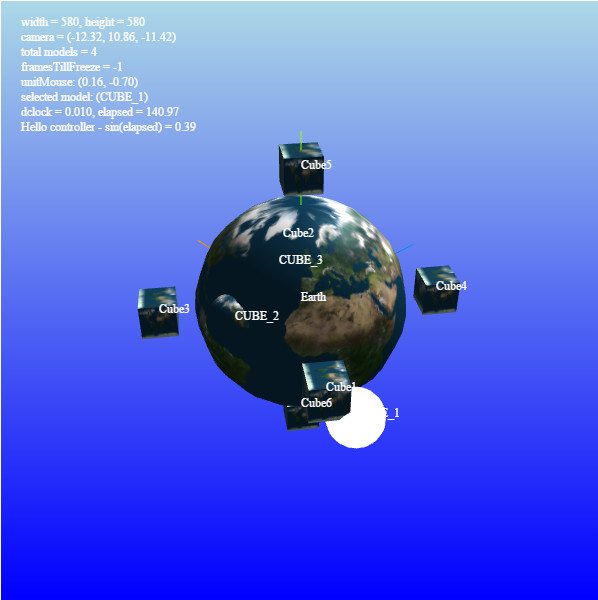
- Working on globe chart
- Adding an IComponentConfig. Which found an error!
- Got Hierarchical placement working – pretty picture for the day:
Phil 5/13/15
8:00 – 4:00 SR
- Backups
- Had a weird issue where the touch command wasn’t working in the Makefile. It looks like putting it in system32 is ok for the command window, but not ok for a program – it had to be on the path. I put it in with the gnu files and it works now.
- Had a long-ish discussion with Dong about how to set the data in the message. It’s much better now. Here are the interfaces:
export interface IMinMax { min:number; max:number; } export interface IChartDataElement{ [label:string]:IMinMax; } export interface IChartMessage{ type:string; name:string; data:IChartDataElement; } - And here are some messages caught by the listener in Wgl2DController (‘min’ is a point that uses the ‘min’ value from the minmax object:
{"type":"bar","name":"Facts","data":{"Jan":{"min":0,"max":125}}} {"type":"min","name":"Future FACTS","data":{"Sep":{"min":200.17,"max":266.49}}} {"type":"area","name":"Future FACTS","data":{"Jun":{"min":202.29,"max":202.29},"Jul":{"min":193.38,"max":215.48},"Aug":{"min":196.77,"max":240.99},"Sep":{"min":200.17,"max":266.49},"Oct":{"min":203.57,"max":291.99},"Nov":{"min":206.96,"max":317.5},"Dec":{"min":210.36,"max":343}}} - Adding data objects on:
- Area chart – done
- Bar Chart -done
- Start bars/spheres chart (lat/long)(min/max)
- Set up WebGl3dCharts.ts and added it to the Makefile
- Tomorrow, create a WglChart3D.html file and maybe a new controller?
Phil 5/12/15
8:00 – 4:00 SR
- backups
- Deployed new Dong’s FR code
- Added data objects to WglComponents and got messages to work with them.
Dong Shin 05.12.2015
- deployed charting-data, didn’t have a chance to go over
- Lenny wants us come in on Thursday to add project related data to FR app
- could not get directives (ng-min, ng-max, currency-input) to behave correctly for Obligations….
Dong Shin 05.11.2015
- working on FR
- currency directive?
- changed all $ inputs to use input-currency directive
- obligations/outlays doesn’t work well because of other directives used – ng-min, ng-max, etc… may have to set the priorities of the directives used
- charting-data
- fixed query to use sum and group by, will try on-site tomorrow.
Phil 5.11.15
7:30 – 2:30 SR
- This could be a good read: Inside The AngularJS Directive Compiler
- Backups
- Lenny’s thinking that the ACRN is causing more problems than it’s worth and would like to explore how the Reqonciler would work if that column were ignored.
- Adding events to the WglCanvas. Still trying to figure out what should be in the data object. Starting with a component description interface for each graphical component that looks like this:
-
export interface IComponentDescription{ typeString:string; objName:string; calloutText:string; toolTipText:string; } - Well that’s odd. Events are not working in the main app. Not even sure how to debug….
- Turned out that I was passing in the wrong things. allowing an ‘any’ object as a parameter, so TypeScript didn’t catch it.
Dong Shin 05.08.2015
- deployed new FR and Charting Data Navigator
- FR fixes as requested
- Charting Data appears returning single REQ data….
- created Test Case class for ChartDataService
Phil 5/8/15
7:30 – 11:00 SR
- Backups
- Integrate charts and events. Need to add data to the picking code. The event needs to be
this.myMessenger.broadcast('WebGLCanvas:selected', model.getDescription());. The data object will have the detailed information.
Dong Shin 05.07.2015
- deployed FR with POC fixes
- seems behaving correctly
- charting-data app missing files from angular-char-develop folder
- fix request from Lenny
When calculating Total Cost for labor do not include FTE in the calculation.On the Funding Description module change “MIPR Description” to “Funding Description” in both the instructions and data entry area.
- working on formatting currency inputs to display as currency in Input
- inputCurrency directive

You must be logged in to post a comment.