Interesting article on dimension reduction: The faces of God in America: Revealing religious diversity across people and politics What strikes me about this study is actually how similar the depictions are. In belief space, this would be a closely woven neighborhood. It would be interesting to see an equivalent study on a less anthropomorphic deity like Vishnu…
Literature and art have long depicted God as a stern and elderly white man, but do people actually see Him this way? We use reverse correlation to understand how a representative sample of American Christians visualize the face of God, which we argue is indicative of how believers think about God’s mind. In contrast to historical depictions, Americans generally see God as young, Caucasian, and loving, but perceptions vary by believers’ political ideology and physical appearance. Liberals see God as relatively more feminine, more African American, and more loving than conservatives, who see God as older, more intelligent, and more powerful. All participants see God as similar to themselves on attractiveness, age, and, to a lesser extent, race. These differences are consistent with past research showing that people’s views of God are shaped by their group-based motivations and cognitive biases. Our results also speak to the broad scope of religious differences: even people of the same nationality and the same faith appear to think differently about God’s appearance.
Finished paper
Working on talk
personal
Shopping – done
taxes
laundry – done
generator/un-grounded short extension cord – done. Works!
Users polarization and confirmation bias play a key role in misinformation spreading on online social media. Our aim is to use this information to determine in advance potential targets for hoaxes and fake news. In this paper, we introduce a general framework for promptly identifying polarizing content on social media and, thus, “predicting” future fake news topics. We validate the performances of the proposed methodology on a massive Italian Facebook dataset, showing that we are able to identify topics that are susceptible to misinformation with 77% accuracy. Moreover, such information may be embedded as a new feature in an additional classifier able to recognize fake news with 91% accuracy. The novelty of our approach consists in taking into account a series of characteristics related to users behavior on online social media, making a first, important step towards the smoothing of polarization and the mitigation of misinformation phenomena.
Social media enabled a direct path from producer to consumer of contents changing the way users get informed, debate, and shape their worldviews. Such a {\em disintermediation} weakened consensus on social relevant issues in favor of rumors, mistrust, and fomented conspiracy thinking — e.g., chem-trails inducing global warming, the link between vaccines and autism, or the New World Order conspiracy. In this work, we study through a thorough quantitative analysis how different conspiracy topics are consumed in the Italian Facebook. By means of a semi-automatic topic extraction strategy, we show that the most discussed contents semantically refer to four specific categories: environment, diet, health, and {\em geopolitics}. We find similar patterns by comparing users activity (likes and comments) on posts belonging to different semantic categories. However, if we focus on the lifetime — i.e., the distance in time between the first and the last comment for each user — we notice a remarkable difference within narratives — e.g., users polarized on geopolitics are more persistent in commenting, whereas the less persistent are those focused on diet related topics. Finally, we model users mobility across various topics finding that the more a user is active, the more he is likely to join all topics. Once inside a conspiracy narrative users tend to embrace the overall corpus.
More Bit by Bit. Reading the section on ethics. It strikes me that simulation could be a way to cut the PII Gordion Knot in some conditions. If a simulation can be developed that generates statistically similar data to the desired population, then the simulated data and the simulation code can be released to the research community. The dataset becomes infinite and adjustable, while the PII data can be held back. Machine learning systems trained on the simulated data can then be evaluated on the confidential data. The differences in the classification by the ML systems between real data and simulated data can also provide insight into the gaps in fidelity of the simulated data, which would provide an ongoing improvement to the simulation, which could in turn be released to the community.
Continuing with the cleanup of the SASO paper. Mostly done but some trimming of redundent bits and the “Ose Simple Trick” paragraph.
Come up with 3-5 options for a finished state for the dissertation. It probably ranges from “pure theory” through “instance based on theory” to “a map generated by the system that matches the theory”
Once the SASO paper is in, set up a “wine and cheese” get together for the committee to go over the current work and discuss changes to the next phase
Start on a new IRB. Emphasize how everyone will have the same system to interact with, though their interactions will be different. Emphasize that the system has to allow open interaction to provide the best chance to realize theoretical results.
ISTAS is a multi-disciplinary and interdisciplinary forum for engineers, policy makers, entrepreneurs, philosophers, researchers, social scientists, technologists, and polymaths to collaborate, exchange experiences, and discuss the social implications of technology.
Disentangling the effects of selection and influence is one of social science’s greatest unsolved puzzles: Do people befriend others who are similar to them, or do they become more similar to their friends over time? Recent advances in stochastic actor-based modeling, combined with self-reported data on a popular online social network site, allow us to address this question with a greater degree of precision than has heretofore been possible. Using data on the Facebook activity of a cohort of college students over 4 years, we find that students who share certain tastes in music and in movies, but not in books, are significantly likely to befriend one another. Meanwhile, we find little evidence for the diffusion of tastes among Facebook friends—except for tastes in classical/jazz music. These findings shed light on the mechanisms responsible for observed network homogeneity; provide a statistically rigorous assessment of the coevolution of cultural tastes and social relationships; and suggest important qualifications to our understanding of both homophily and contagion as generic social processes.
Cleaning up the SASO paper. Lots of good suggestions.
Understanding how species are distributed across landscapes over time is a fundamental question in biodiversity research. Unfortunately, most species distribution models only target a single species at a time, despite strong ecological evidence that species are not independently distributed. We propose Deep Multi-Species Embedding (DMSE), which jointly embeds vectors corresponding to multiple species as well as vectors representing environmental covariates into a common high-dimensional feature space via a deep neural network. Applied to bird observational data from the citizen science project \textit{eBird}, we demonstrate how the DMSE model discovers inter-species relationships to outperform single-species distribution models (random forests and SVMs) as well as competing multi-label models. Additionally, we demonstrate the benefit of using a deep neural network to extract features within the embedding and show how they improve the predictive performance of species distribution modelling. An important domain contribution of the DMSE model is the ability to discover and describe species interactions while simultaneously learning the shared habitat preferences among species. As an additional contribution, we provide a graphical embedding of hundreds of bird species in the Northeast US.
Start fixing This one Simple Trick
Highlighted all the specified changes. There are a lot of them!
Started working on figure 2, and realized (after about an hour of Illustrator work) that the figure is correct. I need to verify each comment before fixing it!
Researched NN anomaly detection. That work seems to have had its heyday in the ’90s, with more conventional (but computationally intensive) methods being preferred these days.
I also thought that Dr. Li’s model had a time-orthogonal component for prediction, but I don’t think that’s true. THe NN is finding the frequency and bounds on its own.
Wrote up a paragraph expressing my concerns and sent to Aaron.
Do bots have the capacity to influence the flow of political information over social media? This working paper answers this question through two methodological avenues: A) a qualitative analysis of how political bots were used to support United States presidential candidates and campaigns during the 2016 election, and B) a network analysis of bot influence on Twitter during the same event. Political bots are automated software programs that operate on social media, written to mimic real people in order to manipulate public opinion. The qualitative findings are based upon nine months of fieldwork on the campaign trail, including interviews with bot makers, digital campaign strategists, security consultants, campaign staff, and party officials. During the 2016 campaign, a bipartisan range of domestic and international political actors made use of political bots. The Republican Party, including both self-proclaimed members of the “alt-right” and mainstream members, made particular use of these digital political tools throughout the election. Meanwhile, public conversation from campaigners and government representatives is inconsistent about the political influence of bots. This working paper provides ethnographic evidence that bots affect information flows in two key ways: 1) by “manufacturing consensus,” or giving the illusion of significant online popularity in order to build real political support, and 2) by democratizing propaganda through enabling nearly anyone to amplify online interactions for partisan ends. We supplement these findings with a quantitative network analysis of the influence bots achieved within retweet networks of over 17 million tweets, collected during the 2016 US election. The results of this analysis confirm that bots reached positions of measurable influence during the 2016 US election. Ultimately, therefore, we find that bots did affect the flow of information during this particular event. This mixed methods approach shows that bots are not only emerging as a widely-accepted tool of computational propaganda used by campaigners and citizens, but also that bots can influence political processes of global significance.
Read the SASO comments. Most are pretty good. My reviewer #2 was #3 this time. There is some rework that’s needed. Most of the comments are good, even the angry ones from #3, which are mostly “where is particle swarm optimization???”
Got an example quad chart from Helena that I’m going to base mine on
Bot stampede reaction to “evolution” in a thread about UNIX. This is in this case posting scentiment against the wrong thing. There are layers here though. It can also be advertising. Sort of the dark side of diversity injection.
Examining a sample of 1,091 inventions I investigate the magnitude and distribution of the pre‐tax internal rate of return (IRR) to inventive activity. The average IRR on a portfolio investment in these inventions is 11.4%. This is higher than the risk‐free rate but lower than the long‐run return on high‐risk securities and the long‐run return on early‐stage venture capital funds. The portfolio IRR is significantly higher, for some ex anteidentifiable classes of inventions. The distribution of return is skew: only between 7‐9% reach the market. Of the 75 inventions that did, six realised returns above 1400%, 60% obtained negative returns and the median was negative.
Conventional wisdom would have us believe that it is always beneficial to be first – first in, first to market, first in class. The popular business literature is full of support for being first and legions of would-be business leaders, steeped in the Jack Welch school of business strategy, will argue this to be the case. The advantages accorded to those who are first to market defines the concept of First Mover Advantage (FMA). We outline why this is not the case, and in fact, that there are conditions of applicability in order for FMA to hold (and these conditions often do not hold). We also show that while there can be advantages to being first, from an economic perspective, the costs generally exceed the benefits, and the full economics of FMA are usually a losing proposition. Finally, we show that increasingly, we live in a world where FMA is eclipsed by innovation and format change, rendering the FMA concept obsolete (i.e. strategic obsolescence).
Recent research has suggested that young users are not particularly skilled in assessing the credibility of online content. A follow up study comparing students to fact checkers noticed that students spend too much time on the page itself, while fact checkers performed “lateral reading”, searching other sources. We have taken this line of research one step further and designed a study in which participants were instructed to do lateral reading for credibility assessment by inspecting Google’s search engine result page (SERP) of unfamiliar news sources. In this paper, we summarize findings from interviews with 30 participants. A component of the SERP noticed regularly by the participants is the so-called Knowledge Panel, which provides contextual information about the news source being searched. While this is expected, there are other parts of the SERP that participants use to assess the credibility of the source, for example, the freshness of top stories, the panel of recent tweets, or a verified Twitter account. Given the importance attached to the presence of the Knowledge Panel, we discuss how variability in its content affected participants’ opinions. Additionally, we perform data collection of the SERP page for a large number of online news sources and compare them. Our results indicate that there are widespread inconsistencies in the coverage and quality of information included in Knowledge Panels.
White paper
Add something about geospatial mapping of belief.
Note that belief maps are cultural artifacts, so comparing someone from one belief space to others in a shared physical belief environment can be roughly equivalent to taking the dot product of the belief space vectors that you need to compare. This could produce a global “alignment map” that can suggest how aligned, opposed, or indifferent a population might be with respect to an intervention, ranging from medical (Ebola teams) to military (special forces operations).
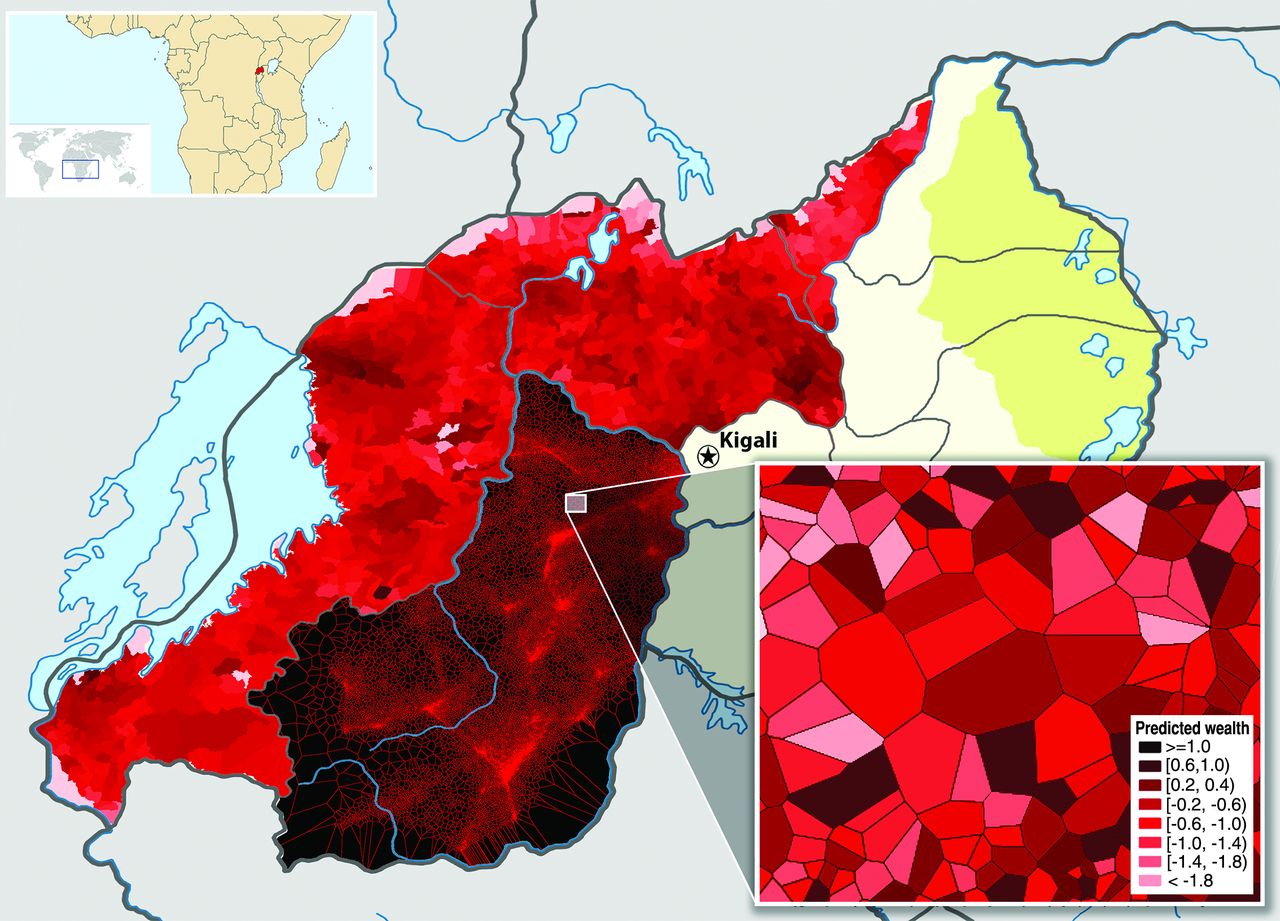
Similar maps related to wealth in Rwanda based on phone metadata: Blumenstock, Joshua E., Gabriel Cadamuro, and Robert On. 2015. “Predicting Poverty and Wealth from Mobile Phone Metadata.” Science350 (6264):1073–6. https://doi.org/10.1126/science.aac4420.
Added a section about how mapping belief maps would afford prediction about local belief, since overall state, orientation and velocity could be found for some individuals who are geolocated to that area and then extrapolated over the region.
Does lunch table size impact workplace productivity? By using analytics and mapping interactions, we found that increasing lunch table size boosted performance by 10%. And the approach has implications reaching far beyond the cafeteria.
KQED is playing America Abroad – today on russian disinfo ops:
Revelations of Russian meddling in the 2016 US presidential election were a shock to Americans. But it wasn’t quite as surprising to people in former Soviet states and the EU. For years they’ve been exposed to Russian disinformation and slanted state media; before that Soviet propaganda filtered into the mainstream. We don’t know how effective Russian information warfare was in swaying the US election. But we do know these tactics have roots going back decades and will most likely be used for years to come. This hour, we’ll hear stories of Russian disinformation and attempts to sow chaos in Europe and the United States. We’ll learn how Russia uses its state-run media to give a platform to conspiracy theorists and how it invites viewers to doubt the accuracy of other news outlets. And we’ll look at the evolution of internet trolling from individuals to large troll farms. And — finally — what can be done to counter all this?
Some interesting papers on the “Naming Game“, a form of coordination where individuals have to agree on a name for something. This means that there is some kind of dimension reduction involved from all the naming possibilities to the agreed-on name.
Colour naming games are idealised communicative interactions within a population of artificial agents in which a speaker uses a single colour term to draw the attention of a hearer to a particular object in a shared context. Through a series of such games, a colour lexicon can be developed that is sufficiently shared to allow for successful communication, even when the agents start out without any predefined categories. In previous models of colour naming games, the shared context was typically artificially generated from a set of colour stimuli and both agents in the interaction perceive this environment in an identical way. In this paper, we investigate the dynamics of the colour naming game in a robotic setup in which humanoid robots perceive a set of colourful objects from their own perspective. We compare the resulting colour ontologies to those found in human languages and show how these ontologies reflect the environment in which they were developed.
In this paper, we study the interaction effect between the naming game and one of the simplest, yet most important collective behaviour studied in swarm robotics: self-organised aggregation. This collective behaviour can be seen as the building blocks for many others, as it is required in order to gather robots, unable to sense their global position, at a single location. Achieving this collective behaviour is particularly challenging, especially in environments without landmarks. Here, we augment a classical aggregation algorithm with a naming game model. Experiments reveal that this combination extends the capabilities of the naming game as well as of aggregation: It allows the emergence of more than one word, and allows aggregation to form a controllable number of groups. These results are very promising in the context of collective exploration, as it allows robots to divide the environment in different portions and at the same time give a name to each portion, which can be used for more advanced subsequent collective behaviours.
More Bit by Bit. Could use some worked examples. Also a login so I’m not nagged to buy a book I own.
Three studies examined the behavioral implications of a conceptual distinction between 2 types of social norms: descriptive norms, which specify what is typically done in a given setting, and injunctive norms, which specify what is typically approved in society. Using the social norm against littering, injunctive norm salience procedures were more robust in their behavioral impact across situations than were descriptive norm salience procedures. Focusing Ss on the injunctive norm suppressed littering regardless of whether the environment was clean or littered (Study 1) and regardless of whether the environment in which Ss could litter was the same as or different from that in which the norm was evoked (Studies 2 and 3). The impact of focusing Ss on the descriptive norm was much less general. Conceptual implications for a focus theory of normative conduct are discussed along with practical implications for increasing socially desirable behavior.
Construct validity centers around the match between the data and the theoretical constructs. As discussed in chapter 2, constructs are abstract concepts that social scientists reason about. Unfortunately, these abstract concepts don’t always have clear definitions and measurements.
Simulation is a way of implementing theoretical constructs that are measurable and testable.
The computational demands associated with navigating large, complexly bonded social groups are thought to have significantly shaped human brain evolution. Yet, research on social network representation and cognitive neuroscience have progressed largely independently. Thus, little is known about how the human brain encodes the structure of the social networks in which it is embedded. This review highlights recent work seeking to bridge this gap in understanding. While the majority of research linking social network analysis and neuroimaging has focused on relating neuroanatomy to social network size, researchers have begun to define the neural architecture that encodes social network structure, cognitive and behavioral consequences of encoding this information, and individual differences in how people represent the structure of their social world.
This website is amazing, linear algebra with interactive examples. Vectors, matrix, dot product, etc, cool resource for learning http://immersivemath.com/ila/index.html
Interesting article that indicates that deep learning generalizes through some form of compression. If that’s true, then the teurons and layers are learning how to coordinate (who recognizes what), which means dimension reduction and localized alignment (what are the features that make a person vs. a ship). Hmmm.
Shwartz-Ziv, R., and Tishby, N. Opening the Black Box of Deep Neural Networks via Information. ArXiv: https://arxiv.org/abs/1703.00810Zhang, C., Bengio, S., Hardt, M., Recht, B., and Vinyalis, O. Understanding Deep Learning Requires Rethinking Generalization. ArXiV: https://arxiv.org/abs/1611.03530Poggio, T., Liao, Q., Miranda, B., Rosasco, L., Boix, X., Hidary, J., and Mhaskar, H. Theory of Deep Learning III: Explaining the Non-Overfitting Puzzle. CBMM Memo 073 (2017). https://cbmm.mit.edu/sites/default/files/publications/CBMM-Memo-073.pdfAchille, A., Rovere, M., and Soatto, S. Critical Learning Periods in Deep Neural Networks. UCLA-TR-170017. ArXiV: https://arxiv.org/abs/1711.08856
This explorable illustrates the Kuramoto model for phase coupled oscillators. This model is used to describe synchronization phenomena in natural systems, e.g. the flash synchronization of fire flies or wall-mounted clocks. The model is defined as a system of NN oscillators. Each oscillator has a phase variable θn(t)θn(t) (illustrated by the angular position on a circle below), and an angular frequency ωnωn that captures how fast the oscillator moves around the circle.
This explorable illustrates how a school of fish can collectively find an optimal location, e.g. a dark, unexposed region in their environment simply by light-dependent speed control. The explorable is based on the model discussed in Flock’n Roll, which you may want to explore first. This is how it works: The swarm here consists of 100 individuals. Each individual moves around at a constant speed and changes direction according to three rules
More cool software: Kepler.gl is a powerful open source geospatial analysis tool for large-scale data sets.
White paper. Good progress! I like the conclusions
Reading more Bit by Bit. At the end of chapter two, Salganik mentions inference graphs, which made me think of Markov Chains which led me to Judea Pearl. Interesting morning.
Continuing Bit by Bit. Nicely written. currently reading about the pros and cons of using big data. It’s making me think about how to structure the Jury Room data so that it lends itself better to prolonged research.
In this post you will learn what is doc2vec, how it’s built, how it’s related to word2vec, what can you do with it, hopefully with no mathematic formulas.
The combination of tags and paragraph/document ID could make this very nice for JuryRoom
Military cartography is studied in order to approach the role of information in war. This serves as an opportunity to reconsider the Military Revolution and in particular changes in the eighteenth century. Mapping is approached not only in tactical, operational and strategic terms, but also with reference to the mapping of war for public interest. Shifts in the latter reflect changes in the geography of European conflict.
A rutteris a mariner’s handbook of written sailing directions. Before the advent of nautical charts, rutters were the primary store of geographic information for maritime navigation.
It was known as a periplus (“sailing-around” book) in classical antiquity and a portolano (“port book”) to medieval Italian sailors in the Mediterranean Sea. Portuguese navigators of the 16th century called it a roteiro, the French a routier, from which the English word “rutter” is derived. In Dutch, it was called a leeskarte (“reading chart”), in German a Seebuch (“sea book”), and in Spanish a derroterro
In a world in which computers and networks are increasingly ubiquitous, computing, information, and computation play a central role in how humans work, learn, live, discover, and communicate. Technology is increasingly embedded throughout society, and is becoming commonplace in almost everything we do. The boundaries between humans and technology are shrinking to the point where socio-technical systems are becoming natural extensions to our human experience – second nature, helping us, caring for us, and enhancing us. As a result, computing technologies and human lives, organizations, and societies are co-evolving, transforming each other in the process. Cyber-Human Systems (CHS) research explores potentially transformative and disruptive ideas, novel theories, and technological innovations in computer and information science that accelerate both the creation and understanding of the complex and increasingly coupled relationships between humans and technology with the broad goal of advancing human capabilities: perceptual and cognitive, physical and virtual, social and societal.
Reworked Section 1 to incorporate all this in a single paragraph
Large cascades can develop in online social networks as people share information with one another. Though simple reshare cascades have been studied extensively, the full range of cascading behaviors on social media is much more diverse. Here we study how diffusion protocols, or the social exchanges that enable information transmission, affect cascade growth, analogous to the way communication protocols define how information is transmitted from one point to another. Studying 98 of the largest information cascades on Facebook, we find a wide range of diffusion protocols – from cascading reshares of images, which use a simple protocol of tapping a single button for propagation, to the ALS Ice Bucket Challenge, whose diffusion protocol involved individuals creating and posting a video, and then nominating specific others to do the same. We find recurring classes of diffusion protocols, and identify two key counterbalancing factors in the construction of these protocols, with implications for a cascade’s growth: the effort required to participate in the cascade, and the social cost of staying on the sidelines. Protocols requiring greater individual effort slow down a cascade’s propagation, while those imposing a greater social cost of not participating increase the cascade’s adoption likelihood. The predictability of transmission also varies with protocol. But regardless of mechanism, the cascades in our analysis all have a similar reproduction number (≈ 1.8), meaning that lower rates of exposure can be offset with higher per-exposure rates of adoption. Last, we show how a cascade’s structure can not only differentiate these protocols, but also be modeled through branching processes. Together, these findings provide a framework for understanding how a wide variety of information cascades can achieve substantial adoption across a network.
Continuing with creating the Simplest LSTM ever
All work and no play makes jack a dull boy indexes alphabetically as :


You must be logged in to post a comment.