Category Archives: thesis

Phil 11.21.18

7:00 – 4:00 ASRC PhD/NASA

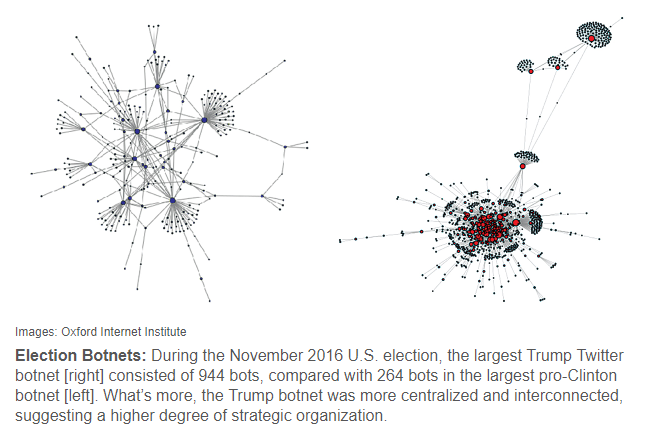
  • More adversarial herding: Bots increase exposure to negative and inflammatory content in online social systems
    • Social media can deeply influence reality perception, affecting millions of people’s voting behavior. Hence, maneuvering opinion dynamics by disseminating forged content over online ecosystems is an effective pathway for social hacking. We propose a framework for discovering such a potentially dangerous behavior promoted by automatic users, also called “bots,” in online social networks. We provide evidence that social bots target mainly human influencers but generate semantic content depending on the polarized stance of their targets. During the 2017 Catalan referendum, used as a case study, social bots generated and promoted violent content aimed at Independentists, ultimately exacerbating social conflict online. Our results open challenges for detecting and controlling the influence of such content on society.
    • Bot detection appendix
      • It occurs to me that if bots can be detected, then they can be mapped in aggregate on the belief map. This could show what types of beliefs are being artificially enhanced or otherwise influenced
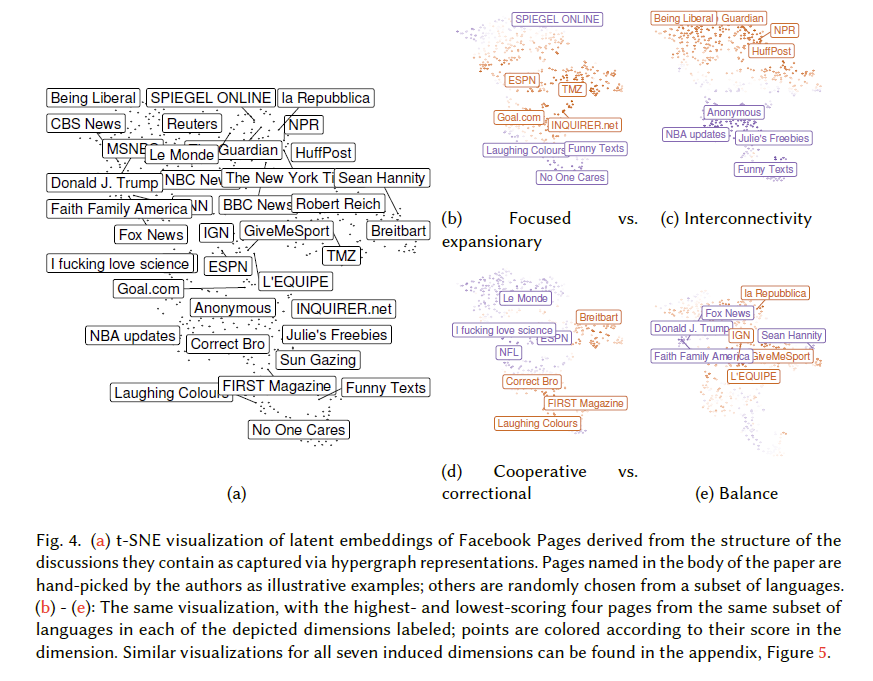
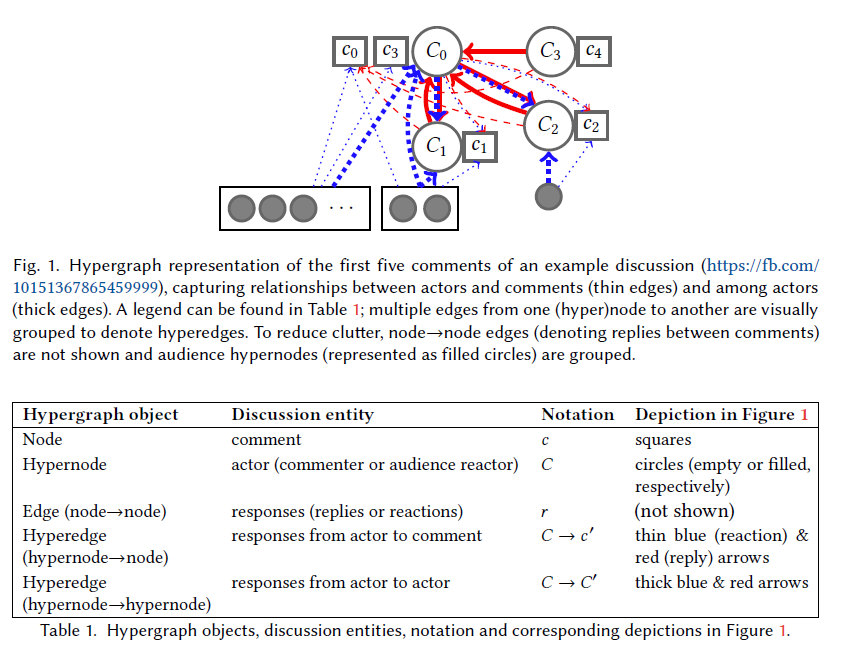
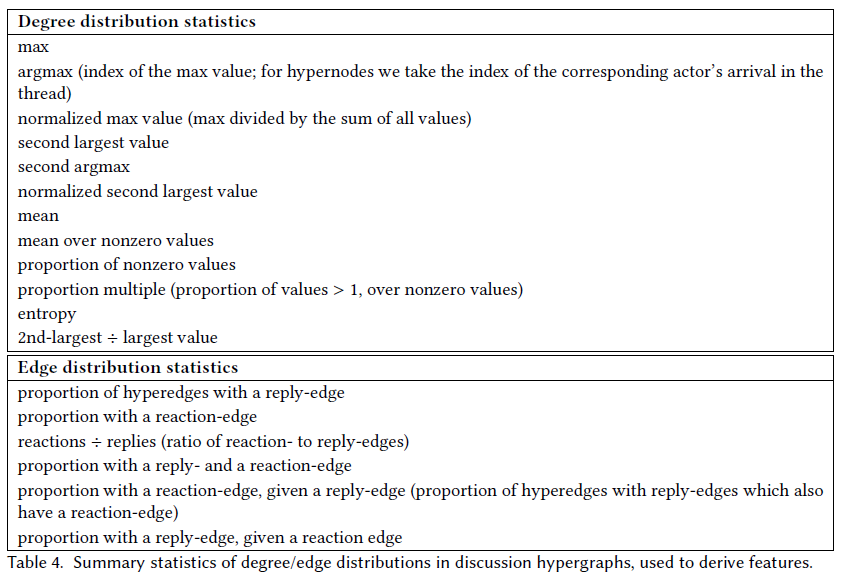
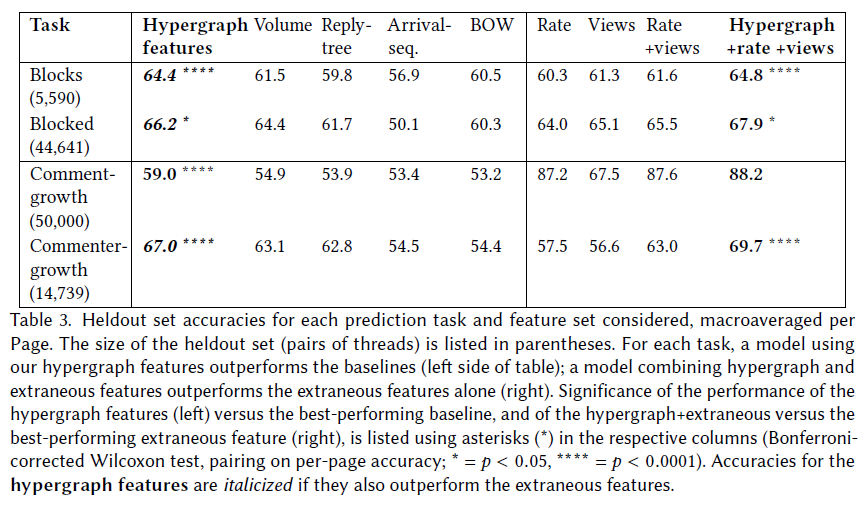
  • Migrating Characterizing Online Public Discussions through Patterns of Participant Interactions to Phlog. Done!
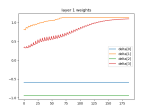
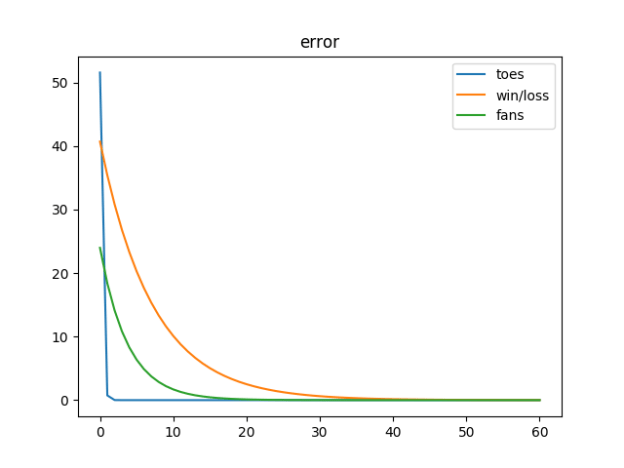
  • Working my way through Grokking. Today’s progress:
    # based on https://github.com/iamtrask/Grokking-Deep-Learning/blob/master/Chapter6%20-%20Intro%20to%20Backpropagation%20-%20Building%20Your%20First%20DEEP%20Neural%20Network.ipynb
    import numpy as np
    import matplotlib.pyplot as plt
    import typing
    # methods --------------------------------------------
    
    
    # sets all negative numbers to zero
    def relu(x: np.array) -> np.array :
        return (x > 0) * x
    
    
    def relu2deriv(output: float) -> float:
        return output > 0 # returns 1 for input > 0
        # return 0 otherwise
    
    
    def nparray_to_list(vals: np.array) -> typing.List[float]:
        data = []
        for x in np.nditer(vals):
            data.append(float(x))
        return data
    
    
    def plot_mat(title: str, var_name: str, fig_num: int, mat: typing.List[float], transpose: bool = False):
        f = plt.figure(fig_num)
        np_mat = np.array(mat)
        if transpose:
            np_mat = np_mat.T
        plt.plot(np_mat)
        names = []
        for i in range(len(np_mat)):
            names.append("{}[{}]".format(var_name, i))
        plt.legend(names)
        plt.title(title)
    
    # variables ------------------------------------------
    np.random.seed(1)
    hidden_size= 4
    alpha = 0.2
    
    weights_input_to_1_array = 2 * np.random.random((3, hidden_size)) - 1
    weights_1_to_output_array = 2 * np.random.random((hidden_size, 1)) - 1
    # the samples. Columns are the things we're sampling
    streetlights_array = np.array( [[ 1, 0, 1 ],
                                    [ 0, 1, 1 ],
                                    [ 0, 0, 1 ],
                                    [ 1, 1, 1 ] ] )
    
    # The data set we want to map to. Each entry in the array matches the corresponding streetlights_array roe
    walk_vs_stop_array = np.array([1, 1, 0, 0]).T # and why are we using the transpose here?
    
    error_plot_mat = [] # for drawing plots
    weights_l1_to_output_plot_mat = [] # for drawing plots
    weights_input_to_l1_plot_mat = [] # for drawing plots
    
    iter = 0
    max_iter = 1000
    epsilon = 0.001
    layer_2_error = 2 * epsilon
    
    while layer_2_error > epsilon:
        layer_2_error = 0
        for row_index in range(len(streetlights_array)):
            # input holds one instance of the data set at a time
            input_layer_array = streetlights_array[row_index:row_index + 1]
            # layer one holds the results of the NONLINEAR transformation of the input layer's values (multiply by weights and relu)
            layer_1_array = relu(np.dot(input_layer_array, weights_input_to_1_array))
            # output layer takes the LINEAR transformation of the values in layer one and sums them (mult)
            output_layer = np.dot(layer_1_array, weights_1_to_output_array)
    
            # the error is the difference of the output layer and the goal squared
            goal = walk_vs_stop_array[row_index:row_index + 1]
            layer_2_error += np.sum((output_layer - goal) ** 2)
    
            # compute the amount to adjust the transformation weights for layer one to output
            layer_1_to_output_delta = (goal - output_layer)
            # compute the amount to adjust the transformation weights for input to layer one
            input_to_layer_1_delta= layer_1_to_output_delta.dot(weights_1_to_output_array.T) * relu2deriv(layer_1_array)
    
            #Still need to figure out why the transpose, but this is where we incrementally adjust the weights
            l1t_array = layer_1_array.T
            ilt_array = input_layer_array.T
            weights_1_to_output_array += alpha * l1t_array.dot(layer_1_to_output_delta)
            weights_input_to_1_array += alpha * ilt_array.dot(input_to_layer_1_delta)
    
            print("[{}] Error: {:.3f}, L0: {}, L1: {}, L2: {}".format(iter, layer_2_error, input_layer_array, layer_1_array, output_layer))
    
            #print("[{}] Error: {}, Weights: {}".format(iter, total_error, weight_array))
            error_plot_mat.append([layer_2_error])
    
            weights_input_to_l1_plot_mat.append(nparray_to_list(weights_input_to_1_array))
            weights_l1_to_output_plot_mat.append(nparray_to_list(weights_1_to_output_array))
    
            iter += 1
            # stop even if we don't converge
            if iter > max_iter:
                break
    
    print("\n--------------evaluation")
    for row_index in range(len(streetlights_array)):
        input_layer_array = streetlights_array[row_index:row_index + 1]
        layer_1_array = relu(np.dot(input_layer_array, weights_input_to_1_array))
        output_layer = np.dot(layer_1_array, weights_1_to_output_array)
    
        print("{} = {:.3f} vs. {}".format(input_layer_array, float(output_layer), walk_vs_stop_array[row_index]))
    
    # plots ----------------------------------------------
    
    f1 = plt.figure(1)
    plt.plot(error_plot_mat)
    plt.title("error")
    plt.legend(["layer_2_error"])
    
    plot_mat("input to layer 1 weights", "weight", 2, weights_input_to_l1_plot_mat)
    plot_mat("layer 1 to output weights", "weight", 3, weights_l1_to_output_plot_mat)


    plt.show()


Phil 11.20.18

7:00 – 3:30 ASRC PhD/NASA

  • Disrupting the Coming Robot Stampedes: Designing Resilient Information Ecologies got accepted to the iConference! Time to start thinking about the slide deck…
    • Workshop: Online nonsense: tools and teaching to combat fake news on the Web
      • How can we raise the quality of what we find on the Web? What software might we build, what education might we try to provide, and what procedures (either manual or mechanical) might be introduced? What are the technical and legal issues that limit our responses? The speakers will suggest responses to problems, and we’ll ask the audience what they would do in specific circumstances. Examples might include anti-vaccination pages, nonstandard cancer treatments, or climate change denial. We will compare with past history, such as the way CB radio became useless as a result of too much obscenity and abuse, or the way the Hearst newspapers created the Spanish-American War. We’ll report out the suggestions and evaluations of the audience.
  • SocialOcean: Visual Analysis and Characterization of Social Media Bubbles
    • Social media allows citizens, corporations, and authorities to create, post, and exchange information. The study of its dynamics will enable analysts to understand user activities and social group characteristics such as connectedness, geospatial distribution, and temporal behavior. In this context, social media bubbles can be defined as social groups that exhibit certain biases in social media. These biases strongly depend on the dimensions selected in the analysis, for example, topic affinity, credibility, sentiment, and geographic distribution. In this paper, we present SocialOcean, a visual analytics system that allows for the investigation of social media bubbles. There exists a large body of research in social sciences which identifies important dimensions of social media bubbles (SMBs). While such dimensions have been studied separately, and also some of them in combination, it is still an open question which dimensions play the most important role in defining SMBs. Since the concept of SMBs is fairly recent, there are many unknowns regarding their characterization. We investigate the thematic and spatiotemporal characteristics of SMBs and present a visual analytics system to address questions such as: What are the most important dimensions that characterize SMBs? and How SMBs embody in the presence of specific events that resonate with them? We illustrate our approach using three different real scenarios related to the single event of Boston Marathon Bombing, and political news about Global Warming. We perform an expert evaluation, analyze the experts’ feedback, and present the lessons learned.
  • More Grokking. We’re at backpropagation, and I’m not seeing it yet. The pix are cool though:
  • Continuing Characterizing Online Public Discussions through Patterns of Participant Interactions.
    • This paper introduces a computational framework to characterize public discussions, relying on a representation that captures a broad set of social patterns which emerge from the interactions between interlocutors, comments and audience reactions. (Page 198:1)
    • we use it to predict the eventual trajectory of individual discussions, anticipating future antisocial actions (such as participants blocking each other) and forecasting a discussion’s growth (Page 198:1)
    • platform maintainers may wish to identify salient properties of a discussion that signal particular outcomes such as sustained participation [9] or future antisocial actions [16], or that reflect particular dynamics such as controversy [24] or deliberation [29]. (Page 198:1)
    • Systems supporting online public discussions have affordances that distinguish them from other forms of online communication. Anybody can start a new discussion in response to a piece of content, or join an existing discussion at any time and at any depth. Beyond textual replies, interactions can also occur via reactions such as likes or votes, engaging a much broader audience beyond the interlocutors actively writing comments. (Page 198:2)
      • This is why JuryRoom would be distinctly different. It’s unique affordances should create unique, hopefully clearer results.
    • This multivalent action space gives rise to salient patterns of interactional structure: they reflect important social attributes of a discussion, and define axes along which discussions vary in interpretable and consequential ways. (Page 198:2)
    • Our approach is to construct a representation of discussion structure that explicitly captures the connections fostered among interlocutors, their comments and their reactions in a public discussion setting. We devise a computational method to extract a diverse range of salient interactional patterns from this representation—including but not limited to the ones explored in previous work—without the need to predefine them. We use this general framework to structure the variation of public discussions, and to address two consequential tasks predicting a discussion’s future trajectory: (a) a new task aiming to determine if a discussion will be followed by antisocial events, such as the participants blocking each other, and (b) an existing task aiming to forecast the growth of a discussion [9]. (Page 198:2)
    • We find that the features our framework derives are more informative in forecasting future events in a discussion than those based on the discussion’s volume, on its reply structure and on the text of its comments (Page 198:2)
    • we find that mainstream print media (e.g., The New York Times, The Guardian, Le Monde, La Repubblica) is separable from cable news channels (e.g., CNN, Fox News) and overtly partisan outlets (e.g., Breitbart, Sean Hannity, Robert Reich)on the sole basis of the structure of the discussions they trigger (Figure 4).(Page 198:2)
    • Figure 4
    • These studies collectively suggest that across the broader online landscape, discussions take on multiple types and occupy a space parameterized by a diversity of axes—an intuition reinforced by the wide range of ways in which people engage with social media platforms such as Facebook [25]. With this in mind, our work considers the complementary objective of exploring and understanding the different types of discussions that arise in an online public space, without predefining the axes of variation. (Page 198:3)
    • Many previous studies have sought to predict a discussion’s eventual volume of comments with features derived from their content and structure, as well as exogenous information [893069, inter alia]. (Page 198:3)
    • Many such studies operate on the reply-tree structure induced by how successive comments reply to earlier ones in a discussion rooted in some initial content. Starting from the reply-tree view, these studies seek to identify and analyze salient features that parameterize discussions on platforms like Reddit and Twitter, including comment popularity [72], temporal novelty [39], root-bias [28], reply-depth [41, 50] and reciprocity [6]. Other work has taken a linear view of discussions as chronologically ordered comment sequences, examining properties such as the arrival sequence of successive commenters [9] or the extent to which commenters quote previous contributions [58]. The representation we introduce extends the reply-tree view of comment-to-comment. (Page 198:3)
    • Our present approach focuses on representing a discussion on the basis of its structural rather than linguistic attributes; as such, we offer a coarser view of the actions taken by discussion participants that more broadly captures the nature of their contributions across contexts which potentially exhibit large linguistic variation.(Page 198:4)
    • This representation extends previous computational approaches that model the relationships between individual comments, and more thoroughly accounts for aspects of the interaction that arise from the specific affordances offered in public discussion venues, such as the ability to react to content without commenting. Next, we develop a method to systematically derive features from this representation, hence producing an encoding of the discussion that reflects the interaction patterns encapsulated within the representation, and that can be used in further analyses.(Page 198:4)
    • In this way, discussions are modelled as collections of comments that are connected by the replies occurring amongst them. Interpretable properties of the discussion can then be systematically derived by quantifying structural properties of the underlying graph: for instance, the indegree of a node signifies the propensity of a comment to draw replies. (Page 198:5)
      • Quick responses that reflect a high degree of correlation would be tight. A long-delayed “like” could be slack?
    • For instance, different interlocutors may exhibit varying levels of engagement or reciprocity. Activity could be skewed towards one particularly talkative participant or balanced across several equally-prolific contributors, as can the volume of responses each participant receives across the many comments they may author.(Page 198: 5)
    • We model this actor-focused view of discussions with a graph-based representation that augments the reply-tree model with an additional superstructure. To aid our following explanation, we depict the representation of an example discussion thread in Figure 1 (Page 198: 6)
    • Fig1Table1
    • Relationships between actors are modeled as the collection of individual responses they exchange. Our representation reflects this by organizing edges into hyperedges: a hyperedge between a hypernode C and a node c ‘ contains all responses an actor directed at a specific comment, while a hyperedge between two hypernodes C and C’ contains the responses that actor C directed at any comment made by C’ over the entire discussion. (Page 198: 6)
      • I think that this  can be represented as a tensor (hyperdimensional or flattened) with each node having a value if there is an intersection. There may be an overall scalar that allows each type of interaction to be adjusted as a whole
    • The mixture of roles within one discussion varies across different discussions in intuitively meaningful ways. For instance, some discussions are skewed by one particularly active participant, while others may be balanced between two similarly-active participants who are perhaps equally invested in the discussion. We quantify these dynamics by taking several summary statistics of each in/outdegree distribution in the hypergraph representation, such as their maximum, mean and entropy, producing aggregate characterizations of these properties over an entire discussion. We list all statistics computed in the appendices (Table 4). (Page 198: 6, 7)
    • Table4
    • To interpret the structure our model offers and address potentially correlated or spurious features, we can perform dimensionality reduction on the feature set our framework yields. In particular, let X be a N×k matrix whose N rows each correspond to a thread represented by k features.We perform a singular value decomposition on X to obtain a d-dimensional representation X ˜ Xˆ = USVT where rows of U are embeddings of threads in the induced latent space and rows of V represent the hypergraph-derived features. (Page 198: 9)
      • This lets us find the hyperplane of the map we want to build
    • Community-level embeddings. We can naturally extend our method to characterize online discussion communities—interchangeably, discussion venues—such as Facebook Pages. To this end, we aggregate representations of the collection of discussions taking place in a community, hence providing a representation of communities in terms of the discussions they foster. This higher level of aggregation lends further interpretability to the hypergraph features we derive. In particular, we define the embedding U¯C of a community C containing threads {t1, t2, . . . tn } as the average of the corresponding thread embeddings Ut1 ,Ut2 , . . .Utn , scaled to unit l2 norm. Two communities C1 and C2 that foster structurally similar discussions then have embeddings U¯C1 and U¯C2 that are close in the latent space.(Page 198: 9)
      • And this may let us place small maps in a larger map. Not sure if the dimensions will line up though
    • The set of threads to a post may be algorithmically re-ordered based on factors like quality [13]. However, subsequent replies within a thread are always listed chronologically.We address elements of such algorithmic ranking effects in our prediction tasks (§5). (Page 198: 10)
    • Taken together, these filtering criteria yield a dataset of 929,041 discussion threads.(Page 198: 10)
    • We now apply our framework to forecast a discussion’s trajectory—can interactional patterns signal future thread growth or predict future antisocial actions? We address this question by using the features our method extracts from the 10-comment prefix to predict two sets of outcomes that occur temporally after this prefix. (Pg 198:10)
      • These are behavioral trajectories, though not belief trajectories. Maps of these behaviors could probably be built, too.
    • For instance, news articles on controversial issues may be especially susceptible to contentious discussions, but this should not translate to barring discussions about controversial topics outright. Additionally, in large-scale social media settings such as Facebook, the content spurring discussions can vary substantially across different sub-communities, motivating the need to seek adaptable indicators that do not hinge on content specific to a particular context. (Page 198: 11)
    • Classification protocol. For each task, we train logistic regression classifiers that use our full set of hypergraph-derived features, grid-searching over hyperparameters with 5-fold cross-validation and enforcing that no Page spans multiple folds.13 We evaluate our models on a (completely fresh) heldout set of thread pairs drawn from the subsequent week of data (Nov. 8-14, 2017), addressing a model’s potential dependence on various evolving interface features that may have been deployed by Facebook during the time spanned by the training data. (Page 198: 11)
      • We use logistic regression classifiers from scikit-learn with l2 loss, standardizing features and grid-searching over C = {0.001, 0.01, 1}. In the bag-of-words models, we tf-idf transform features, set a vocabulary size of 5,000 words and additionally grid-search over the maximum document frequency in {0.25, 0.5, 1}. (Page 198: 11, footnote 13)
    • We test a model using the temporal rate of commenting, which was shown to be a much stronger signal of thread growth than the structural properties considered in prior work [9] (Page 198: 12)
    • Table 3 shows Page-macroaveraged heldout accuracies for our prediction tasks. The feature set we extract from our hypergraph significantly outperforms all of the baselines in each task. This shows that interactional patterns occurring within a thread’s early activity can signal later events, and that our framework can extract socially and structurally-meaningful patterns that are informative beyond coarse counts of activity volume, the reply-tree alone and the order in which commenters contribute, along with a shallow representation of the linguistic content discussed. (Page 198: 12)
      • So triangulation from a variety of data sources produces more accurate results in this context, and probably others. Not a surprising finding, but important to show
    • Table3
    • We find that in almost all cases, our full model significantly outperforms each subcomponent considered, suggesting that different parts of the hypergraph framework add complementary information across these tasks. (Page 198: 13)
    • Having shown that our approach can extract interaction patterns of practical importance from individual threads, we now apply our framework to explore the space of public discussions occurring on Facebook. In particular, we identify salient axes along which discussions vary by qualitatively examining the latent space induced from the embedding procedure described in §3, with d = 7 dimensions. Using our methodology, we recover intuitive types of discussions, which additionally reflect our priors about the venues which foster them. This analysis provides one possible view of the rich landscape of public discussions and shows that our thread representation can structure this diverse space of discussions in meaningful ways. This procedure could serve as a starting point for developing taxonomies of discussions that address the wealth of structural interaction patterns they contain, and could enrich characterizations of communities to systematically account for the types of discussions they foster. (Page 198: 14) 
      • ^^^Show this to Wayne!^^^
    • The emergence of these groupings is especially striking since our framework considers just discussion structure without explicitly encoding for linguistic, topical or demographic data. In fact, the groupings produced often span multiple languages—the cluster of mainstream news sites at the top includes French (Le Monde), Italian (La Repubblica) and German (SPIEGEL ONLINE) outlets; the “sports” region includes French (L’EQUIPE) as well as English outlets. This suggests that different types of content and different discussion venues exhibit distinctive interactional signatures, beyond lexical traits. Indeed, an interesting avenue of future work could further study the relation between these factors and the structural patterns addressed in our approach, or augment our thread representation with additional contextual information. (Page 198: 15)
    • Taken together, we can use the features, threads and Pages which are relatively salient in a dimension to characterize a type of discussion. (Page 198: 15)
    • To underline this finer granularity, for each examined dimension we refer to example discussion threads drawn from a single Page, The New York Times (https://www.facebook.com/nytimes), which are listed in the footnotes. (Page 198: 15)
      • Common starting point. Do they find consensus, or how the dimensions reduce?
    • Focused threads tend to contain a small number of active participants replying to a large proportion of preceding comments; expansionary threads are characterized by many less-active participants concentrating their responses on a single comment, likely the initial one. We see that (somewhat counterintuitively) meme-sharing discussion venues tend to have relatively focused discussions. (Page 198: 15)
      • These are two sides of the same dimension-reduction coin. A focused thread should be using the dimension-reduction tool of open discussion that requires the participants to agree on what they are discussing. As such it refines ideas and would produce more meme-compatible content. Expansive threads are dimension reducing to the initial post. The subsequent responses go in too many directions to become a discussion.
    • Threads at one end (blue) have highly reciprocal dyadic relationships in which both reactions and replies are exchanged. Since reactions on Facebook are largely positive, this suggests an actively supportive dynamic between actors sharing a viewpoint, and tend to occur in lifestyle-themed content aggregation sub-communities as well as in highly partisan sites which may embody a cohesive ideology. In threads at the other end (red), later commenters tend to receive more reactions than the initiator and also contribute more responses. Inspecting representative threads suggests this bottom-heavy structure may signal a correctional dynamic where late arrivals who refute an unpopular initiator are comparatively well-received. (Page 198: 17)
    • This contrast reflects an intuitive dichotomy of one- versus multi-sided discussions; interestingly, the imbalanced one-sided discussions tend to occur in relatively partisan venues, while multi-sided discussions often occur in sports sites (perhaps reflecting the diversity of teams endorsed in these sub-communities). (Page 198: 17)
      • This means that we can identify one-sided behavior and use that then to look at they underlying information. No need to look in diverse areas, they are taking care of themselves. This is ecosystem management 101, where things like algae blooms and invasive species need to be recognized and then managed
    • We now seek to contrast the relative salience of these factors after controlling for community: given a particular discussion venue, is the content or the commenter more responsible for the nature of the ensuing discussions? (Page 198: 17)
    • This suggests that, perhaps somewhat surprisingly, the commenter is a stronger driver of discussion type. (Page 198: 18)
      • I can see that. The initial commenter is kind of a gate-keeper to the discussion. A low-dimension, incendiary comment that is already aligned with one group (“lock her up”), will create one kind of discussion, while a high-dimensional, nuanced post will create another.
    • We provide a preliminary example of how signals derived from discussion structure could be applied to forecast blocking actions, which are potential symptoms of low-quality interactions (Page 198: 18)
    • Important references

Phil 11.19.18

6:00 – 2:30 ASRC PhD, NASA

  • Antonio didn’t make much in the way of modifications, so I think the paper is now done. Ask tomorrow if it’s alright to put this version on ArXive.
  • ‘Nothing on this page is real’: How lies become truth in online America
    • A new message popped onto Blair’s screen from a friend who helped with his website. “What viral insanity should we spread this morning?” the friend asked. “The more extreme we become, the more people believe it,” Blair replied.
    • “No matter how racist, how bigoted, how offensive, how obviously fake we get, people keep coming back,” Blair once wrote, on his own personal Facebook page. “Where is the edge? Is there ever a point where people realize they’re being fed garbage and decide to return to reality?”
  • Blind appears to be the LinkedIn version of Secret/Whisper
    • Blind is an anonymous social networking platform for professionals. Work email-verified professionals can connect with coworkers and other company/industry professionals by holding meaningful conversations on a variety of different topics.
  • Started reading Third Person. It really does look like the literature is thin:
    • A crucial consideration when editing our previous volume, Second Person, was to give close attention to the underexamined area of tabletop role-playing games. Generally speaking, what scholarly consideration these games have received has cast them as of historical interest, as forerunners of today’s digital games. In his chapter here, Ken Rolston-the designer of major computer role-playing games such as the Elder Scrolls titles Morrowind and Oblivion-says that his strongest genre influences are tabletop RPGs and live-action role-playing (IARP) games. He considers nonwired RPGs to be a continuing vital force, and so do we. (Page 7)
  • Quick meeting with Wayne
    • CHI Play 2019
      • CHI PLAY is the international and interdisciplinary conference (by ACM SIGCHI) for researchers and professionals across all areas of play, games and human-computer interaction (HCI). We call this area “player-computer interaction.”  22–25 October 2019
    • Conversation Map: An Interface for Very-Large-Scale Conversations
      • Very large-scale conversation (VLSC) involves the exchange of thousands of electronic mail (e-mail) messages among hundreds or thousands of people. Usenet newsgroups are good examples (but not the only examples) of online sites where VLSCs take place. To facilitate understanding of the social and semantic structure of VLSCs, two tools from the social sciences—social networks and semantic networks—have been extended for the purposes of interface design. As interface devices, social and semantic networks need to be flexible, layered representations that are useful as a means for summarizing, exploring, and cross-indexing the large volumes of messages that constitute the archives of VLSCs. This paper discusses the design criteria necessary for transforming these social scientific representations into interface devices. The discussion is illustrated with the description of the Conversation Map system, an implemented system for browsing and navigating VLSCs.
    • Terra Nova blog
    • Nic Ducheneaut
      • My research pioneered the use of large-scale, server-side data for modeling behavior in video games. At Xerox PARC I founded the PlayOn project, which conducted the longest and largest quantitative study of user behavior in World of Warcraft (500,000+ players observed over 5 years). At Ubisoft, I translated my findings into practical recommendations for both video game designers and business leaders. Today, as the co-founder and technical lead of Quantic Foundry, I help game companies bridge analytics and game design to maximize player engagement and retention.
    • Nick Yee
      • I’m the co-founder and analytics lead of Quantic Foundry, a consulting practice around game analytics. I combine social science, data science, and an understanding of the psychology of gamers to generate actionable insights in gameplay and game design.
    • Celia pierce
      • Celia Pearce is a game designer, artist, author, curator, teacher, and researcher specializing in multiplayer gaming and virtual worlds, independent, art, and alternative game genres, as well as games and gender. 
    • T. L. Taylor
      • T.L. Taylor is is a qualitative sociologist who has focused on internet and game studies for over two decades. Her research explores the interrelations between culture and technology in online leisure environments. 
    • MIT10: A Reprise – Democracy and Digital Media
      • Paper proposals might address the following topics/issues:
        • politics of truth/lies, alternative facts
        • media, authoritarianism, and polarization
        • diversity in gaming / livestreaming / esports
        • making or breaking publics with algorithmic cultures/machine learning/AI
        • environmental media (from medium theory to climate change) and activism
        • media infrastructures as public utilities or utility publics?
        • social media, creating consensus, and bursting filter bubbles
        • designing media technologies for inclusion
        • the #metoo movement and its impact
        • social media platforms (FaceBook, Twitter, Instagram, etc), politics, and civic responsibility
        • Twitter, viral videos, and the new realities of political advertising
      • Please submit individual paper proposals, which should include a title, author(s) name, affiliation, 250-word abstract, and 75-word biographical statement to this email address: media-in-transition@mit.edu — by February 1, 2019. Early submissions are encouraged and we will review them on a rolling basis. Full panel proposals of 3 to 4 speakers can also be submitted, and should include a panel title and the details listed above for each paper, as well as a panel moderator. We notify you of the status of your proposals by February 15, 2019 at the latest.
  • Continuing Characterizing Online Public Discussions through Patterns of Participant Interactions. Sheesh, that’s a long article. 21 pages!
  • More Grokking: Here’s a very simple full NN:
    # based on https://github.com/iamtrask/Grokking-Deep-Learning/blob/master/Chapter6%20-%20Intro%20to%20Backpropagation%20-%20Building%20Your%20First%20DEEP%20Neural%20Network.ipynb
    import numpy as np
    import matplotlib.pyplot as plt
    
    # variables ------------------------------------------
    
    # one weight for each column (or light - the things we're sampling)
    weight_array = np.random.rand(3)
    alpha = 0.1
    
    # the samples. Columns are the things we're sampling
    streetlights_array = np.array([[1, 0, 1],
                                   [ 0, 1, 1 ],
                                   [ 0, 0, 1 ],
                                   [ 1, 1, 1 ],
                                   [ 0, 1, 1 ],
                                   [ 1, 0, 1 ]])
    
    # The data set we want to map to. Each entry in the array matches the corresponding streetlights_array roe
    walk_vs_stop_array = np.array([0, 1, 0, 1, 1, 0])
    
    error_plot_mat = [] # for drawing plots
    weight_plot_mat = [] # for drawing plots
    iter = 0
    max_iter = 1000
    epsilon = 0.001
    total_error = 2 * epsilon
    
    while total_error > epsilon:
        total_error = 0
        for row_index in range(len(walk_vs_stop_array)):
            input_array = streetlights_array[row_index]
            goal_prediction = walk_vs_stop_array[row_index]
    
            prediction = input_array.dot(weight_array)
            error = (goal_prediction - prediction) ** 2
            total_error += error
    
            delta = prediction - goal_prediction
            weight_array = weight_array - (alpha * (input_array * delta))
    
            print("[{}] Error: {}, Weights: {}".format(iter, total_error, weight_array))
            error_plot_mat.append([total_error, error])
            weight_plot_mat.append(weight_array.copy())
    
            iter += 1
            if iter > max_iter:
                break
    
    
    f1 = plt.figure(1)
    plt.plot(error_plot_mat)
    plt.title("error")
    plt.legend(["total_error", "error"])
    #f1.show()
    
    f2 = plt.figure(2)
    plt.plot(weight_plot_mat)
    names = []
    for i in range(len(weight_array)):
        names.append("weight[{}]".format(i))
    plt.legend(names)
    plt.title("weights")
    
    #f2.show()
    plt.show()
  • And here is it learning

Phil 11.16.18

7:00 – 4:00 PhD/NASA ASRC

Phil 11.15.18

ASRC PhD, NASA 7:00 – 5:00

  • Incorporate T’s changes – done!
  • Topic Modeling with LSA, PLSA, LDA & lda2Vec
    • This article is a comprehensive overview of Topic Modeling and its associated techniques.
  • More Grokking. Here’s the work for the day:
    # based on https://github.com/iamtrask/Grokking-Deep-Learning/blob/master/Chapter5%20-%20Generalizing%20Gradient%20Descent%20-%20Learning%20Multiple%20Weights%20at%20a%20Time.ipynb
    import numpy as np
    import matplotlib.pyplot as plt
    import random
    
    # methods ----------------------------------------------------------------
    def neural_network(input, weights):
        out = input @ weights
        return out
    
    def error_gt_epsilon(epsilon: float, error_array: np.array) -> bool:
        for i in range(len(error_array)):
            if error_array[i] > epsilon:
                return True
        return False
    
    # setup vars --------------------------------------------------------------
    #inputs
    toes_array =  np.array([8.5, 9.5, 9.9, 9.0])
    wlrec_array = np.array([0.65, 0.8, 0.8, 0.9])
    nfans_array = np.array([1.2, 1.3, 0.5, 1.0])
    
    #output goals
    hurt_array  = np.array([0.2, 0.0, 0.0, 0.1])
    wl_binary_array   = np.array([  1,   1,   0,   1])
    sad_array   = np.array([0.3, 0.0, 0.1, 0.2])
    
    weights_array = np.random.rand(3, 3) # initialise with random weights
    '''
    #initialized with fixed weights to compare with the book
    weights_array = np.array([ [0.1, 0.1, -0.3], #hurt?
                             [0.1, 0.2,  0.0], #win?
                             [0.0, 1.3,  0.1] ]) #sad?
    '''
    alpha = 0.01 # convergence scalar
    
    # just use the first element from each array fro training (for now?)
    input_array = np.array([toes_array[0], wlrec_array[0], nfans_array[0]])
    goal_array = np.array([hurt_array[0], wl_binary_array[0], sad_array[0]])
    
    line_mat = [] # for drawing plots
    epsilon = 0.01 # how close do we have to be before stopping
    #create and fill an error array that is big enough to enter the loop
    error_array = np.empty(len(input_array))
    error_array.fill(epsilon * 2)
    
    # loop counters
    iter = 0
    max_iter = 100
    
    while error_gt_epsilon(epsilon, error_array): # if any error in the array is big, keep going
    
        #right now, the dot product of the (3x1) input vector and the (3x3) weight vector that returns a (3x1) vector
        pred_array = neural_network(input_array, weights_array)
    
        # how far away are we linearly (3x1)
        delta_array = pred_array - goal_array
        # error is distance squared to keep positive and weight the system to fixing bigger errors (3x1)
        error_array = delta_array ** 2
    
        # Compute how far and in what direction (3x1)
        weights_d_array = delta_array * input_array
    
        print("\niteration [{}]\nGoal = {}\nPred = {}\nError = {}\nDelta = {}\nWeight Deltas = {}\nWeights: \n{}".format(iter, goal_array, pred_array, error_array, delta_array, weights_d_array, weights_array))
    
        #subtract the scaled (3x1) weight delta array from the weights array
        weights_array -= (alpha * weights_d_array)
    
        #build the data for the plot
        line_mat.append(np.copy(error_array))
        iter += 1
        if iter > max_iter:
            break
    
    plt.plot(line_mat)
    plt.title("error")
    plt.legend(("toes", "win/loss", "fans"))
    plt.show()
  • Here’s a chart! Learning
  • Continuing Characterizing Online Public Discussions through Patterns of Participant Interactions

Phil 11.14.18

7:00 – 4:00 ASRC PhD, NASA

  • Discovered Critical Roll D&D Youtube channel
  • Talk to Aaron about adding a time (or post?) constraint to dungeon runs. Faster runs/fewer posts get higher scores. This might be a way to highlight the difference between homogeneous and heterogeneous party composition lexical variance.
  • Added the conversation analytic link to the Belief Spaces doc
  • Added the following bit to my main blog post on Lists, Stories and Maps
  • Add to the Stories, Lists and Maps writeup something about the cognitive power of stories. There is, in many religions and philosophies, the concept of “being in the moment” where we become simply aware of what’s going on right now, without all the cognitive framing and context that we normally bring to every experience [citation needed]. This is different from “mindfulness”, where we try to be aware of the cognitive framing and context. To me, this is indicative of how we experience life through the lens of path dependency, which is a sort of a narrative. If this is true, then it explains the power of stories, because it allows us to literally step into another life. This explains phrases like “losing yourself in a story”.
  • This doesn’t happen with lists. It only happens in special cases in diagrams and maps, where you can see yourself in the map. Which is why the phrase “the map is not the territory” is different from “losing yourself in the story”. In the first case, you confuse your virtual and actual environment. In the latter, you confuse your virtual and actual identity. And since that story becomes part of your path through life, the virtual is incorporated into the actual life narrative, particularly if the story is vivid.
  • So narratives are an alignment mechanism. Simple stories that collapse information into a already existing beliefs can be confirming and reinforcing across a broad population. Complicated stories that challenge existing beliefs require a change in alignment to incorporate. That’s computationally expensive, and will affect fewer people, all things being equal.
  • Which leads me to thinking that the need for novelty is what creates the heading and velocity driven behavior we see in belief space behavior. I think this needs to be a chapter in the dissertation. Just looking for some background literature, I found these:
    • Novelty-Seeking in Rats-Biobehavioral Characteristics and Possible Relationship with the Sensation-Seeking Trait in Man
      • A behavioral trait in rats which resembles some of the features of high-sensation seekers in man has been characterized. Given that the response to novelty is the basis of the definition of sensation-seeking, individual differences in reactivity to novelty have been studied on behavioral and biological levels. Certain individuals labeled as high responders (HR) as opposed to low responders (LR) have been shown to be highly reactive when exposed to a novel environment. These groups were investigated for free-choice responses to novel environments differing in complexity and aversiveness, and to other kinds of reinforcement, i.e. food and a drug. The HR rats appeared to seek novelty, variety and emotional stimulation. Only HR individuals have been found to be predisposed to drug-taking: they develop amphetamine self-administration whereas LR individuals do not. They also exhibit a higher sensitivity to the reinforcing properties of food. On a biological level, compared to LR rats, HR animals have an enhanced level of dopaminergic activity in the nucleus accumbens both under basal conditions or following a tail-pinch stress. HR and LR rats differ in reactivity of the corticotropic axis: HR rats exposed to a novel environment have a prolonged secretion of corticosterone compared to LR rats. The association of novelty, drug and food seeking in the same individual suggests that these characteristics share common processes. Differences in dopaminergic activity between HR and LR rats are consistent with results implicating these dopaminergic neurons in response to novelty and in drug-taking behavior. Given that rats self-administer corticosterone and that HR rats are more sensitive to the reinforcing properties of corticoste-roids, it could be speculated that HR rats seek novelty for the reinforcing action of corticosterone. These characteristics may be analogous to some for the features found in human high-sensation seekers and this animal model may be useful in determinating the biological basis of this human trait.
    • The Psychology and Neuroscience of Curiosity
      • Curiosity is a basic element of our cognition, but its biological function, mechanisms, and neural underpinning remain poorly understood. It is nonetheless a motivator for learning, influential in decision-making, and crucial for healthy development. One factor limiting our understanding of it is the lack of a widely agreed upon delineation of what is and is not curiosity. Another factor is the dearth of standardized laboratory tasks that manipulate curiosity in the lab. Despite these barriers, recent years have seen a major growth of interest in both the neuroscience and psychology of curiosity. In this Perspective, we advocate for the importance of the field, provide a selective overview of its current state, and describe tasks that are used to study curiosity and information-seeking. We propose that, rather than worry about defining curiosity, it is more helpful to consider the motivations for information-seeking behavior and to study it in its ethological context.
    • Theory of Choice in Bandit, Information Sampling and Foraging Tasks
      • Decision making has been studied with a wide array of tasks. Here we examine the theoretical structure of bandit, information sampling and foraging tasks. These tasks move beyond tasks where the choice in the current trial does not affect future expected rewards. We have modeled these tasks using Markov decision processes (MDPs). MDPs provide a general framework for modeling tasks in which decisions affect the information on which future choices will be made. Under the assumption that agents are maximizing expected rewards, MDPs provide normative solutions. We find that all three classes of tasks pose choices among actions which trade-off immediate and future expected rewards. The tasks drive these trade-offs in unique ways, however. For bandit and information sampling tasks, increasing uncertainty or the time horizon shifts value to actions that pay-off in the future. Correspondingly, decreasing uncertainty increases the relative value of actions that pay-off immediately. For foraging tasks the time-horizon plays the dominant role, as choices do not affect future uncertainty in these tasks.
  • How Political Campaigns Weaponize Social Media Bots (IEEE)
    • TrumpClintonBotnets
  • Starting Characterizing Online Public Discussions through Patterns of Participant Interactions
  • More Grokking ML

Phil 11.13.18

7:00 – 4:30

  • Bills
  • Get oil change kit from Bob’s
  • Antonio paper – done first complete pass
  • Sent Wayne a note to see if he knows of any online D&D research. My results are thin (see below)
  • Nice chat with Aaron about mapping in the D&D space. We reiterated that the goal of the first paper should be able to do the following:
    • map a linear dungeon
    • map the belief space adjacent to the dungeon (PC debates to consensus on how to proceed)
    • map the space in an open dungeon
    • map the belief space adjacent to an open dungeon
    • Additionally, we should be able to show that diversity (or lack of it) is recognizable. A mixed party should have a broader lexical set than a party of only fighters
    • We also realized that mapping could be a very good lens for digital anthropology. An interesting follow on paper could be an examination of how users run through a known dungeon, such as The Tomb of Horrors to see how the map generates, and to compare that to a version where the names of the items have been disguised so it’s not obvious that it’s the same game
  • Ordered these books. There doesn’t seem to be much else in the space, so I’m curious about the reference section
    • Second Person: Role-Playing and Story in Games and Playable Media (MIT Press)
      • Games and other playable forms, from interactive fictions to improvisational theater, involve role playing and story—something played and something told. In Second Person, game designers, authors, artists, and scholars examine the different ways in which these two elements work together in tabletop role-playing games (RPGs), computer games, board games, card games, electronic literature, political simulations, locative media, massively multiplayer games, and other forms that invite and structure play.  Second Person—so called because in these games and playable media it is “you” who plays the roles, “you” for whom the story is being told—first considers tabletop games ranging from Dungeons & Dragons and other RPGs with an explicit social component to Kim Newman’s Choose Your Own Adventure-style novel Life’s Lottery and its more traditional author-reader interaction. Contributors then examine computer-based playable structures that are designed for solo interaction—for the singular “you”—including the mainstream hit Prince of Persia: The Sands of Time and the genre-defining independent production Façade. Finally, contributors look at the intersection of the social spaces of play and the real world, considering, among other topics, the virtual communities of such Massively Multiplayer Online Role Playing Games (MMORPGs) as World of Warcraft and the political uses of digital gaming and role-playing techniques (as in The Howard Dean for Iowa Game, the first U.S. presidential campaign game).
    • Third Person: Authoring and Exploring Vast Narratives (The MIT Press)
      • The ever-expanding capacities of computing offer new narrative possibilities for virtual worlds. Yet vast narratives—featuring an ongoing and intricately developed storyline, many characters, and multiple settings—did not originate with, and are not limited to, Massively Multiplayer Online Games. Thomas Mann’s Joseph and His Brothers, J. R. R. Tolkien’s Lord of the Rings, Marvel’s Spiderman, and the complex stories of such television shows as Dr. Who, The Sopranos, and Lost all present vast fictional worlds. Third Person explores strategies of vast narrative across a variety of media, including video games, television, literature, comic books, tabletop games, and digital art. The contributors—media and television scholars, novelists, comic creators, game designers, and others—investigate such issues as continuity, canonicity, interactivity, fan fiction, technological innovation, and cross-media phenomena. Chapters examine a range of topics, including storytelling in a multiplayer environment; narrative techniques for a 3,000,000-page novel; continuity (or the impossibility of it) in Doctor Who; managing multiple intertwined narratives in superhero comics; the spatial experience of the Final Fantasy role-playing games; World of Warcraft adventure texts created by designers and fans; and the serial storytelling of The Wire. Taken together, the multidisciplinary conversations in Third Person, along with Harrigan and Wardrip-Fruin’s earlier collections First Person and Second Person, offer essential insights into how fictions are constructed and maintained in very different forms of media at the beginning of the twenty-first century.
  • A Support System to Accumulate Interpretations of Multiple Story Timelines
    • The story base interpretation is subjectively summarised and segmented from the first-person viewpoint. However, we often need to objectively represent an entire image by integrated knowledge. Yet, this is a difficult task. We proposed a novel approach, named the synthetic evidential study (SES), for understanding and augmenting collective thought processes through substantiated thought by interactive media. In this study, we investigated the kind of data that can be obtained through the SES sessions as interpretation archives and whether the database is useful to understand multiple story timelines. For the purpose, we designed a machine-readable interpretation data format and developed support systems to create and provide data that are easy to understand. We conducted an experiment using the simulation of the projection phase in SES sessions. From the results, we suggested that a “meta comment” which was deepened interpretation comment by the others in the interpretation archives to have been posted when it was necessary to consider other participants’ interpretation to broaden their horizons before posting the comment. In addition, the construction of networks to represent the relationships between the interpretation comments enabled us to suggest the important comments by using the degree centrality.

Phil 11.12.18

7:00 – 7:00 ASRC PhD

  • Call Tim Ellis – done
  • Tags – done
  • Bills – nope, including MD EV paperwork -done
  • Get oil change kit from Bob’s – closed
  • Fika – done
  • Finish Similar neural responses predict friendship – Done!
  • Discrete hierarchical organization of social group sizes
    • The ‘social brain hypothesis’ for the evolution of large brains in primates has led to evidence for the coevolution of neocortical size and social group sizes, suggesting that there is a cognitive constraint on group size that depends, in some way, on the volume of neural material available for processing and synthesizing information on social relationships. More recently, work on both human and non-human primates has suggested that social groups are often hierarchically structured. We combine data on human grouping patterns in a comprehensive and systematic study. Using fractal analysis, we identify, with high statistical confidence, a discrete hierarchy of group sizes with a preferred scaling ratio close to three: rather than a single or a continuous spectrum of group sizes, humans spontaneously form groups of preferred sizes organized in a geometrical series approximating 3–5, 9–15, 30–45, etc. Such discrete scale invariance could be related to that identified in signatures of herding behaviour in financial markets and might reflect a hierarchical processing of social nearness by human brains.
  • Work on Antonio’s paper – good progress
  • Aaron added a lot of content to Belief Spaces, and we got together to discuss. Probably the best thing to come out of the discussion was an approach to the dungeons that at one end is an acyclic, directed, linear graph of connected nodes. The map will be a line, with any dilemma discussions connected with the particular nodes. At the other end is an open environment. In between are various open and closed graphs that we can classify with some level of complexity.
  • One of the things that might be interesting to examine is the distance between nodes, and how that affects behavior
  • Need to mention that D&D are among the oldest “digital residents” of the internet, with decades-old artifacts.

Phil 11.9.18

7:00 – ASRC PhD/BD/NASA

  • Started to write up the study design for Belief Spaces/Places in a Google doc
  • More Grokking ML – ok progress
  • Riot – a glossy Matrix collaboration client for the web. http://riot.im
  • Lets Chat is a persistent messaging application that runs on Node.js and MongoDB. It’s designed to be easily deployable and fits well with small, intimate teams. (GitHub)
  • Mattermost is an open source, self-hosted Slack-alternative. As an alternative to proprietary SaaS messaging, Mattermost brings all your team communication into one place, making it searchable and accessible anywhere. It’s written in Golang and React and runs as a production-ready Linux binary under an MIT license with either MySQL or Postgres. (GitHub)
  • PHPbb is hosted on Dreamhost
  • Sprint planning
  • Analysis of visitors’ mobility patterns through random walk in the Louvre museum
    • This paper proposes a random walk model to analyze visitors’ mobility patterns in a large museum. Visitors’ available time makes their visiting styles different, resulting in dissimilarity in the order and number of visited places and in path sequence length. We analyze all this by comparing a simulation model and observed data, which provide us the strength of the visitors’ mobility patterns. The obtained results indicate that shorter stay-type visitors exhibit stronger patterns than those with the longer stay-type, confirming that the former are more selective than the latter in terms of their visitation type.
  • Same Story, Different Story The Neural Representation of Interpretive Frameworks
    • Differences in people’s beliefs can substantially impact their interpretation of a series of events. In this functional MRI study, we manipulated subjects’ beliefs, leading two groups of subjects to interpret the same narrative in different ways. We found that responses in higher-order brain areas—including the default-mode network, language areas, and subsets of the mirror neuron system—tended to be similar among people who shared the same interpretation, but different from those of people with an opposing interpretation. Furthermore, the difference in neural responses between the two groups at each moment was correlated with the magnitude of the difference in the interpretation of the narrative. This study demonstrates that brain responses to the same event tend to cluster together among people who share the same views.
  • Similar neural responses predict friendship
    • Computational Social Neuroscience Lab 
      • The Computational Social Neuroscience Lab is located in the Department of Psychology at UCLA.We study how our brains allow us to represent and navigate the social world. We take a multidisciplinary approach to research that integrates theory and methods from cognitive neuroscience, machine learning, social network analysis, and social psychology.
    • Authors
    • Research has borne out this intuition: social ties are forged at a higher-than expected rate between individuals of the same age, gender, ethnicity, and other demographic categories. This assortativity in friendship networks is referred to as homophily and has been demonstrated across diverse contexts and geographic locations, including online social networks [2, 3, 4, 5(Page 2)
    • When humans do forge ties with individuals who are dissimilar from themselves, these relationships tend to be instrumental, task-oriented (e.g., professional collaborations involving people with complementary skill sets [7]), and short-lived, often dissolving after the individuals involved have achieved their shared goal. Thus, human social networks tend to be overwhelmingly homophilous [8]. (Page 2)
      • This means that groups can be more efficient, but prone to belief stampede
    • Remarkably, social network proximity is as important as genetic relatedness and more important than geographic proximity in predicting the similarity of two individuals’ cooperative behavioral tendencies [4] (Page 2)
    • how individuals interpret and respond to their environment increases the predictability of one another’s thoughts and actions during social interactions [14], since knowledge about oneself is a more valid source of information about similar others than about dissimilar others. (Page 2)
      • There is a second layer on top of this which may be more important. How individuals respond to social cues (which can have significant survival value in a social animal) may be more important than day-to-day reactions to the physical environment.
    • Here we tested the proposition that neural responses to naturalistic audiovisual stimuli are more similar among friends than among individuals who are farther removed from one another in a real-world social network. Measuring neural activity while people view naturalistic stimuli, such as movie clips, offers an unobtrusive window into individuals’ unconstrained thought processes as they unfold [16(page 2)
    • Social network proximity appears to be significantly associated with neural response similarity in brain regions involved in attentional allocation, narrative interpretation, and affective responding (Page 2)
    • We first characterized the social network of an entire cohort of students in a graduate program. All students (N = 279) in the graduate program completed an online survey in which they indicated the individuals in the program with whom they were friends (see Methods for further details). Given that a mutually reported tie is a stronger indicator of the presence of a friendship than an unreciprocated tie, a graph consisting only of reciprocal (i.e., mutually reported) social ties was used to estimate social distances between individuals. (Page 2)
      • I wonder if this changes as people age. Are there gender differences?
    • The videos presented in the fMRI study covered a range of topics and genres (e.g., comedy clips, documentaries, and debates) that were selected so that they would likely be unfamiliar to subjects, effectively constrain subjects’ thoughts and attention to the experiment (to minimize mind wandering), and evoke meaningful variability in responses across subjects (because different subjects attend to different aspects of them, have different emotional reactions to them, or interpret the content differently, for example). (Page 3)
      • I think this might make the influence more environmental than social. It would be interesting to see how a strongly aligned group would deal with a polarizing topic, even something like sports.
    • Mean response time series spanning the course of the entire experiment were extracted from 80 anatomical regions of interest (ROIs) for each of the 42 fMRI study subjects (page 3)
      • 80 possible dimensions. It would be interesting to see this in latent space. That being said, there is no dialog here, so no consensus building, which implies no dimension reduction.
    • To test for a relationship between fMRI response similarity and social distance, a dyad-level regression model was used. Models were specified either as ordered logistic regressions with categorical social distance as the dependent variable or as logistic regression with a binary indicator of reciprocated friendship as the dependent variable. We account for the dependence structure of the dyadic data (i.e., the fact that each fMRI subject is involved in multiple dyads), which would otherwise underestimate the standard errors and increase the risk of type 1 error [20], by clustering simultaneously on both members of each dyad [21, 22].
    • For the purpose of testing the general hypothesis that social network proximity is associated with more similar neural responses to naturalistic stimuli, our main predictor variable of interest, neural response similarity within each student dyad, was summarized as a single variable. Specifically, for each dyad, a weighted average of normalized neural response similarities was computed, with the contribution of each brain region weighted by its average volume in our sample of fMRI subjects. (Page 3)
    • To account for demographic differences that might impact social network structure, our model also included binary predictor variables indicating whether subjects in each dyad were of the same or different nationalities, ethnicities, and genders, as well as a variable indicating the age difference between members of each dyad. In addition, a binary variable was included indicating whether subjects were the same or different in terms of handedness, given that this may be related to differences in brain functional organization [23]. (page 3)
    • Logistic regressions that combined all non-friends into a single category, regardless of social distance, yielded similar results, such that neural similarity was associated with a dramatically increased likelihood of friendship, even after accounting for similarities in observed demographic variables. More specifically, a one SD increase in overall neural similarity was associated with a 47% increase in the likelihood of friendship (logistic regression: ß = 0.388; SE = 0.109; p = 0.0004; N = 861 dyads). Again, neural similarity improved the model’s predictive power above and beyond observed demographic similarities, χ2(1) = 7.36, p = 0.006. (Page 4)
    • To gain insight into what brain regions may be driving the relationship between social distance and overall neural similarity, we performed ordered logistic regression analyses analogous to those described above independently for each of the 80 ROIs, again using cluster-robust standard errors to account for dyadic dependencies in the data. This approach is analogous to common fMRI analysis approaches in which regressions are carried out independently at each voxel in the brain, followed by correction for multiple comparisons across voxels. We employed false discovery rate (FDR) correction to correct for multiple comparisons across brain regions. This analysis indicated that neural similarity was associated with social network proximity in regions of the ventral and dorsal striatum … Regression coefficients for each ROI are shown in Fig. 6, and further details for ROIs that met the significance threshold of p < 0.05, FDR-corrected (two tailed) are provided in Table 2. (Page 4)
      • So the latent space that matters involves something on the order of 7 – 9 regions? I wonder if the actions across regions are similar enough to reduce further. I need to look up what each region does.
    • Table 2Figure6
    • Results indicated that average overall (weighted average) neural similarities were significantly higher among distance 1 dyads than dyads belonging to other social distance categories … distance 4 dyads were not significantly different in overall neural response similarity from dyads in the other social distance categories. All reported p-values are two-tailed. (Page 4)
    • Within the training data set for each data fold, a grid search procedure [24] was used to select the C parameter of a linear support vector machine (SVM) learning algorithm that would best separate dyads according to social distance. (Page 5)
    • As shown in Fig. 8, the classifier tended to predict the correct social distances for dyads in all distance categories at rates above the accuracy level that would be expected based on chance alone (i.e., 25% correct), with an overall classification accuracy of 41.25%. Classification accuracies for distance 1, 2, 3, and 4 dyads were 48%, 39%, 31%, and 47% correct, respectively. (Page 6)
    • where the classifier assigned the incorrect social distance label to a dyad, it tended to be only one level of social distance away from the correct answer: when friends were misclassified, they were misclassified most often as distance 2 dyads; when distance 2 dyads were misclassified, they were misclassified most often as distance 1 or 3 dyads, and so on. (Page 6)
    • The results reported here are consistent with neural homophily: people tend to be friends with individuals who see the world in a similar way. (Page 7)
    • Brain areas where response similarity was associated with social network proximity included subcortical areas implicated in motivation, learning, affective processing, and integrating information into memory, such as the nucleus accumbens, amygdala, putamen, and caudate nucleus [27, 28, 29]. Social network proximity was also associated with neural response similarity within areas involved in attentional allocation, such as the right superior parietal cortex [30,31], and regions in the inferior parietal lobe, such as the bilateral supramarginal gyri and left inferior parietal cortex (which includes the angular gyrus in the parcellation scheme used [32]), that have been implicated in bottom-up attentional control, discerning others’ mental states, processing language and the narrative content of stories, and sense-making more generally [33, 34, 35]. (Page 7)
    • However, the current results suggest that social network proximity may be associated with similarities in how individuals attend to, interpret, and emotionally react to the world around them. (Page 7)
      • Both the environmental and social world
    • A second, not mutually exclusive, possibility pertains to the “three degrees of influence rule” that governs the spread of a wide range of phenomena in human social networks [43]. Data from large-scale observational studies as well as lab-based experiments suggest that wide-ranging phenomena (e.g., obesity, cooperation, smoking, and depression) spread only up to three degrees of geodesic distance in social networks, perhaps due to social influence effects decaying with social distance to the extent that the they are undetectable at social distances exceeding three, or to the relative instability of long chains of social ties [43]. Although we make no claims regarding the causal mechanisms behind our findings, our results show a similar pattern. (Page 8)
      • Does this change with the level of similarity in the group?
    • pre-existing similarities in how individuals tend to perceive, interpret, and respond to their environment can enhance social interactions and increase the probability of developing a friendship via positive affective processes and by increasing the ease and clarity of communication [14, 15]. (Page 8)

Phil 11.7.18

Let the House Subcommittee investigations begin! Also, better redistricting?

7:00 – 5:00 ASRC PhD/BD

  • Rather than Deep Learning with Keras, I’m starting on Grokking Deep Learning. I need better grounding
    • Installed Jupyter
  • After lunch, send follow-up emails to the technical POCs. This will be the basis for the white paper: Tentative findings/implications for design. Modify it on the blog page first and then use to create the LaTex doc. Make that one project, with different mains that share overlapping content.
  • Characterizing Online Public Discussions through Patterns of Participant Interactions
    • Public discussions on social media platforms are an intrinsic part of online information consumption. Characterizing the diverse range of discussions that can arise is crucial for these platforms, as they may seek to organize and curate them. This paper introduces a computational framework to characterize public discussions, relying on a representation that captures a broad set of social patterns which emerge from the interactions between interlocutors, comments and audience reactions. We apply our framework to study public discussions on Facebook at two complementary scales. First, we use it to predict the eventual trajectory of individual discussions, anticipating future antisocial actions (such as participants blocking each other) and forecasting a discussion’s growth. Second, we systematically analyze the variation of discussions across thousands of Facebook sub-communities, revealing subtle differences (and unexpected similarities) in how people interact when discussing online content. We further show that this variation is driven more by participant tendencies than by the content triggering these discussions.
  • More latent space flocking from Innovation Hub
    • You Share Everything With Your Bestie. Even Brain Waves.
      •  Scientists have found that the brains of close friends respond in remarkably similar ways as they view a series of short videos: the same ebbs and swells of attention and distraction, the same peaking of reward processing here, boredom alerts there. The neural response patterns evoked by the videos — on subjects as diverse as the dangers of college football, the behavior of water in outer space, and Liam Neeson trying his hand at improv comedy — proved so congruent among friends, compared to patterns seen among people who were not friends, that the researchers could predict the strength of two people’s social bond based on their brain scans alone.

    • Similar neural responses predict friendship
      • Human social networks are overwhelmingly homophilous: individuals tend to befriend others who are similar to them in terms of a range of physical attributes (e.g., age, gender). Do similarities among friends reflect deeper similarities in how we perceive, interpret, and respond to the world? To test whether friendship, and more generally, social network proximity, is associated with increased similarity of real-time mental responding, we used functional magnetic resonance imaging to scan subjects’ brains during free viewing of naturalistic movies. Here we show evidence for neural homophily: neural responses when viewing audiovisual movies are exceptionally similar among friends, and that similarity decreases with increasing distance in a real-world social network. These results suggest that we are exceptionally similar to our friends in how we perceive and respond to the world around us, which has implications for interpersonal influence and attraction.
    • Brain-to-Brain coupling: A mechanism for creating and sharing a social world
      • Cognition materializes in an interpersonal space. The emergence of complex behaviors requires the coordination of actions among individuals according to a shared set of rules. Despite the central role of other individuals in shaping our minds, most cognitive studies focus on processes that occur within a single individual. We call for a shift from a single-brain to a multi-brain frame of reference. We argue that in many cases the neural processes in one brain are coupled to the neural processes in another brain via the transmission of a signal through the environment. Brain-to-brain coupling constrains and simplifies the actions of each individual in a social network, leading to complex joint behaviors that could not have emerged in isolation.
  • Started reading Similar neural responses predict friendship

Phil 11.6.18

7:00 – 2:00 ASRC PhD/BD

  • Today’s big though: Maps are going top be easier than I thought. We’ve been doing  them for thousands of years with board games.
  • Worked with Aaron on slides, including finding fault detection using our technologies. There is quite a bit, with pioneering work from NASA
  • Uploaded documents – done
  • Called and left messages for Dr. Wilkins and Dr. Palazzolo. Need to send a follow-up email to Dr. Palazzolo and start on the short white papers
  • Leaving early to vote
  • The following two papers seem to be addressing edge stiffness
  • Model of the Information Shock Waves in Social Network Based on the Special Continuum Neural Network
    • The article proposes a special class of continuum neural network with varying activation thresholds and a specific neuronal interaction mechanism as a model of message distribution in social networks. Activation function for every neuron is fired as a decision of the specific systems of differential equations which describe the information distribution in the chain of the network graph. This class of models allows to take into account the specific mechanisms for transmitting messages, where individuals who, receiving a message, initially form their attitude towards it, and then decide on the further transmission of this message, provided that the corresponding potential of the interaction of two individuals exceeds a certain threshold level. The authors developed the original algorithm for calculating the time moments of message distribution in the corresponding chain, which comes to the solution of a series of Cauchy problems for systems of ordinary nonlinear differential equations.
  • A cost-effective algorithm for inferring the trust between two individuals in social networks
    • The popularity of social networks has significantly promoted online individual interaction in the society. In online individual interaction, trust plays a critical role. It is very important to infer the trust among individuals, especially for those who have not had direct contact previously in social networks. In this paper, a restricted traversal method is defined to identify the strong trust paths from the truster and the trustee. Then, these paths are aggregated to predict the trust rate between them. During the traversal on a social network, interest topics and topology features are comprehensively considered, where weighted interest topics are used to measure the semantic similarity between users. In addition, trust propagation ability of users is calculated to indicate micro topology information of the social network. In order to find the topk most trusted neighbors, two combination strategies for the above two factors are proposed in this paper. During trust inference, the traversal depth is constrained according to the heuristic rule based on the “small world” theory. Three versions of the trust rate inference algorithm are presented. The first algorithm merges interest topics and topology features into a hybrid measure for trusted neighbor selection. The other two algorithms consider these two factors in two different orders. For the purpose of performance analysis, experiments are conducted on a public and widely-used data set. The results show that our algorithms outperform the state-of-the-art algorithms in effectiveness. In the meantime, the efficiency of our algorithms is better than or comparable to those algorithms.
  • Back to LSTMs. Made a numeric version of “all work and no play in the jack_torrance generatorAWANPMJADB
  • Reading in and writing out weight files. The predictions seems to be working well, but I have no insight into the arguments that go into the LSTM model. Going to revisit the Deep Learning with Keras book

Phil 11.5.18

7:00- 4:30 ASRC PhD

  • Make integer generator by scaling and shifting the floating point generator to the desired values and then truncating. It would be fun to read in a token list and have the waveform be words
    • Done with the int waveform. This is an integer waveform of the function
      math.sin(xx)*math.sin(xx/2.0)*math.cos(xx/4.0)

      set on a range from 0 – 100:

    •  IntWaves
    • And here’s the unmodified floating-point version of the same function:
    • FloatWaves
    • Here’s the same function as words:
      #confg: {"function":math.sin(xx)*math.sin(xx/2.0)*math.cos(xx/4.0), "rows":100, "sequence_length":20, "step":1, "delta":0.4, "type":"floating_point"}
      routed, traps, thrashing, fifteen, ultimately, dealt, anyway, apprehensions, boats, job, descended, tongue, dripping, adoration, boats, routed, routed, strokes, cheerful, charleses, 
      traps, thrashing, fifteen, ultimately, dealt, anyway, apprehensions, boats, job, descended, tongue, dripping, adoration, boats, routed, routed, strokes, cheerful, charleses, travellers, 
      thrashing, fifteen, ultimately, dealt, anyway, apprehensions, boats, job, descended, tongue, dripping, adoration, boats, routed, routed, strokes, cheerful, charleses, travellers, unsuspected, 
      fifteen, ultimately, dealt, anyway, apprehensions, boats, job, descended, tongue, dripping, adoration, boats, routed, routed, strokes, cheerful, charleses, travellers, unsuspected, malingerer, 
      ultimately, dealt, anyway, apprehensions, boats, job, descended, tongue, dripping, adoration, boats, routed, routed, strokes, cheerful, charleses, travellers, unsuspected, malingerer, respect, 
      dealt, anyway, apprehensions, boats, job, descended, tongue, dripping, adoration, boats, routed, routed, strokes, cheerful, charleses, travellers, unsuspected, malingerer, respect, aback, 
      anyway, apprehensions, boats, job, descended, tongue, dripping, adoration, boats, routed, routed, strokes, cheerful, charleses, travellers, unsuspected, malingerer, respect, aback, vair', 
      apprehensions, boats, job, descended, tongue, dripping, adoration, boats, routed, routed, strokes, cheerful, charleses, travellers, unsuspected, malingerer, respect, aback, vair', wraith, 
      boats, job, descended, tongue, dripping, adoration, boats, routed, routed, strokes, cheerful, charleses, travellers, unsuspected, malingerer, respect, aback, vair', wraith, bare, 
      job, descended, tongue, dripping, adoration, boats, routed, routed, strokes, cheerful, charleses, travellers, unsuspected, malingerer, respect, aback, vair', wraith, bare, creek, 
      descended, tongue, dripping, adoration, boats, routed, routed, strokes, cheerful, charleses, travellers, unsuspected, malingerer, respect, aback, vair', wraith, bare, creek, descended, 
      tongue, dripping, adoration, boats, routed, routed, strokes, cheerful, charleses, travellers, unsuspected, malingerer, respect, aback, vair', wraith, bare, creek, descended, assortment, 
      dripping, adoration, boats, routed, routed, strokes, cheerful, charleses, travellers, unsuspected, malingerer, respect, aback, vair', wraith, bare, creek, descended, assortment, flashed, 
      adoration, boats, routed, routed, strokes, cheerful, charleses, travellers, unsuspected, malingerer, respect, aback, vair', wraith, bare, creek, descended, assortment, flashed, reputation, 
      boats, routed, routed, strokes, cheerful, charleses, travellers, unsuspected, malingerer, respect, aback, vair', wraith, bare, creek, descended, assortment, flashed, reputation, guarded, 
      routed, routed, strokes, cheerful, charleses, travellers, unsuspected, malingerer, respect, aback, vair', wraith, bare, creek, descended, assortment, flashed, reputation, guarded, tempers, 
      routed, strokes, cheerful, charleses, travellers, unsuspected, malingerer, respect, aback, vair', wraith, bare, creek, descended, assortment, flashed, reputation, guarded, tempers, partnership, 
      strokes, cheerful, charleses, travellers, unsuspected, malingerer, respect, aback, vair', wraith, bare, creek, descended, assortment, flashed, reputation, guarded, tempers, partnership, bare, 
      cheerful, charleses, travellers, unsuspected, malingerer, respect, aback, vair', wraith, bare, creek, descended, assortment, flashed, reputation, guarded, tempers, partnership, bare, count, 
      charleses, travellers, unsuspected, malingerer, respect, aback, vair', wraith, bare, creek, descended, assortment, flashed, reputation, guarded, tempers, partnership, bare, count, descended, 
      travellers, unsuspected, malingerer, respect, aback, vair', wraith, bare, creek, descended, assortment, flashed, reputation, guarded, tempers, partnership, bare, count, descended, dashed, 
      unsuspected, malingerer, respect, aback, vair', wraith, bare, creek, descended, assortment, flashed, reputation, guarded, tempers, partnership, bare, count, descended, dashed, ears, 
      malingerer, respect, aback, vair', wraith, bare, creek, descended, assortment, flashed, reputation, guarded, tempers, partnership, bare, count, descended, dashed, ears, q, 


  • Started LSTMs again, using this example using Alice in Wonderland
  • Aaron and T in all day discussions with Kevin about NASA/NOAA. Dropped in a few times. NASA is airgapped, but you can bring code in and out. Bringing code in requires a review.
  • Call the Army BAA people. We need white paper templates and a response for Dr. Palazzolo.
  • Finish and submit 810 reviews tonight. Done.
  • This is important for the DARPA and Army BAAs: The geographic embedding of online echo chambers: Evidence from the Brexit campaign
    • This study explores the geographic dependencies of echo-chamber communication on Twitter during the Brexit campaign. We review the evidence positing that online interactions lead to filter bubbles to test whether echo chambers are restricted to online patterns of interaction or are associated with physical, in-person interaction. We identify the location of users, estimate their partisan affiliation, and finally calculate the distance between sender and receiver of @-mentions and retweets. We show that polarized online echo-chambers map onto geographically situated social networks. More specifically, our results reveal that echo chambers in the Leave campaign are associated with geographic proximity and that the reverse relationship holds true for the Remain campaign. The study concludes with a discussion of primary and secondary effects arising from the interaction between existing physical ties and online interactions and argues that the collapsing of distances brought by internet technologies may foreground the role of geography within one’s social network.
  • Also important:
    • How to Write a Successful Level I DHAG Proposal
      • The idea behind a Level I project is that it can be “high risk/high reward.” Put another way, we are looking for interesting, innovative, experimental, new ideas, even if they have a high potential to fail. It’s an opportunity to figure things out so you are better prepared to tackle a big project. Because of the relatively low dollar amount (no more than $50K), we are willing to take on more risk for an idea with lots of potential. By contrast, at the Level II and especially at the Level III, there is a much lower risk tolerance; the peer reviewers expect that you’ve already completed an earlier start-up or prototyping phase and will want you to convince them your project is ready to succeed.
  • Tracing a Meme From the Internet’s Fringe to a Republican Slogan
    • This feedback loop is how #JobsNotMobs came to be. In less than two weeks, the three-word phrase expanded from corners of the right-wing internet onto some of the most prominent political stages in the country, days before the midterm elections.
  • Effectiveness of gaming for communicating and teaching climate change
    • Games are increasingly proposed as an innovative way to convey scientific insights on the climate-economic system to students, non-experts, and the wider public. Yet, it is not clear if games can meet such expectations. We present quantitative evidence on the effectiveness of a simulation game for communicating and teaching international climate politics. We use a sample of over 200 students from Germany playing the simulation game KEEP COOL. We combine pre- and postgame surveys on climate politics with data on individual in-game decisions. Our key findings are that gaming increases the sense of personal responsibility, the confidence in politics for climate change mitigation, and makes more optimistic about international cooperation in climate politics. Furthermore, players that do cooperate less in the game become more optimistic about international cooperation but less confident about politics. These results are relevant for the design of future games, showing that effective climate games do not require climate-friendly in-game behavior as a winning condition. We conclude that simulation games can facilitate experiential learning about the difficulties of international climate politics and thereby complement both conventional communication and teaching methods.
    • This reinforces the my recent thinking that games may be a fourth, distinct form of human sociocultural communication

Phil 11.1.18

7:00 – 4:30 ASRC PhD

  • Quick thought. Stampedes may be recognized not just from low variance (density of connections), but also the speed that a new term moves into the lexicon (stiffness)
  • The Junk News Aggregator, the Visual Junk News Aggregator and the Top 10 Junk News Aggregator are research projects of the Computational Propaganda group (COMPROP) of the Oxford Internet Institute (OII)at the University of Oxford.These aggregators are intended as tools to help researchers, journalists, and the public see what English language junk news stories are being shared and engaged with on Facebook, ahead of the 2018 US midterm elections on November 6, 2018.The aggregators show junk news posts along with how many reactions they received, for all eight types of post reactions available on Facebook, namely: Likes, Comments, Shares, and the five emoji reactions: Love, Haha, Wow, Angry, and Sad.
  • Reading Charles Perrow’s Normal Accidents. Riveting. All about dense, tightly connected networks with hidden information
    • From The Montreal Review
      • Normal Accident drew attention to two different forms of organizational structure that Herbert Simon had pointed to years before, vertical integration, and what we now call modularity. Examining risky systems in the Accident book, I focused upon the unexpected interactions of different parts of the system that no designer could have expected and no operator comprehend or be able to interdict. Reading Charles Perrow’s Normal Accidents. Riveting. All about dense, tightly connected networks with hidden information
  • Building generators.
    • Need to change the “stepsize” in the Torrance generator to be variable – done. Here’s my little ode to The Shining:
      #confg: {"rows":100, "sequence_length":26, "step":26, "type":"words"}
      all work and no play makes jack a dull boy all work and no play makes jack a dull boy all work and no play makes 
      jack a dull boy all work and no play makes jack a dull boy all work and no play makes jack a dull boy all work 
      and no play makes jack a dull boy all work and no play makes jack a dull boy all work and no play makes jack a 
      dull boy all work and no play makes jack a dull boy all work and no play makes jack a dull boy all work and no 
      play makes jack a dull boy all work and no play makes jack a dull boy all work and no play makes jack a dull boy 
      all work and no play makes jack a dull boy all work and no play makes jack a dull boy all work and no play makes 
      jack a dull boy all work and no play makes jack a dull boy all work and no play makes jack a dull boy all work 
      and no play makes jack a dull boy all work and no play makes jack a dull boy all work and no play makes jack a 
      
    • Need to be able to turn out a numeric equivalent. Done with floating point. This:
      #confg: {"function":math.sin(xx)*math.sin(xx/2.0)*math.cos(xx/4.0), "rows":100, "sequence_length":20, "step":1, "delta":0.4, "type":"floating_point"}
      0.0,0.07697897630719268,0.27378318599563484,0.5027638400821064,0.6604469814238397,0.6714800165989514,0.519596709539434,0.2524851001382131,-0.04065231596017931,-0.2678812526747579,-0.37181365763470914,-0.34898182120310306,-0.24382057359778858,-0.12182487479311599,-0.035942415169752356,-0.0027892469005274916,0.00019865778200507415,0.016268713740310237,0.07979661440830532,0.19146155036709192,
      0.07697897630719312,0.2737831859956355,0.5027638400821071,0.6604469814238401,0.6714800165989512,0.5195967095394334,0.2524851001382121,-0.04065231596018022,-0.26788125267475843,-0.37181365763470925,-0.3489818212031028,-0.24382057359778805,-0.12182487479311552,-0.0359424151697521,-0.0027892469005274395,0.0001986577820050832,0.016268713740310397,0.07979661440830574,0.19146155036709248,0.31158944024296154,
      0.2737831859956368,0.502763840082108,0.6604469814238405,0.6714800165989508,0.5195967095394324,0.25248510013821085,-0.04065231596018143,-0.2678812526747592,-0.37181365763470936,-0.34898182120310245,-0.24382057359778747,-0.12182487479311502,-0.03594241516975184,-0.002789246900527388,0.00019865778200509222,0.01626871374031056,0.07979661440830614,0.191461550367093,0.311589440242962,0.3760334615921674,
      0.5027638400821092,0.6604469814238411,0.6714800165989505,0.5195967095394312,0.25248510013820913,-0.040652315960182955,-0.26788125267476015,-0.37181365763470964,-0.348981821203102,-0.24382057359778667,-0.12182487479311428,-0.03594241516975145,-0.0027892469005273107,0.00019865778200510578,0.016268713740310803,0.07979661440830675,0.1914615503670939,0.3115894402429629,0.3760334615921675,0.3275646734005755,
      0.660446981423842,0.6714800165989498,0.5195967095394289,0.2524851001382062,-0.04065231596018568,-0.2678812526747618,-0.37181365763471,-0.34898182120310123,-0.24382057359778553,-0.1218248747931133,-0.03594241516975093,-0.0027892469005272066,0.00019865778200512388,0.016268713740311122,0.07979661440830756,0.19146155036709495,0.31158944024296387,0.3760334615921676,0.3275646734005745,0.1475692800414062,
      0.671480016598949,0.5195967095394267,0.25248510013820324,-0.04065231596018842,-0.2678812526747636,-0.3718136576347104,-0.34898182120310045,-0.24382057359778414,-0.12182487479311209,-0.03594241516975028,-0.002789246900527077,0.0001986577820051465,0.016268713740311528,0.07979661440830856,0.19146155036709636,0.3115894402429648,0.37603346159216783,0.32756467340057344,0.1475692800414041,-0.12805444308254293,
      0.5195967095394245,0.2524851001382003,-0.04065231596019116,-0.2678812526747653,-0.3718136576347107,-0.3489818212030998,-0.24382057359778303,-0.12182487479311109,-0.03594241516974975,-0.0027892469005269733,0.00019865778200516457,0.016268713740311847,0.07979661440830936,0.19146155036709747,0.3115894402429657,0.37603346159216794,0.32756467340057244,0.147569280041402,-0.1280544430825456,-0.41793663502550105,
      0.2524851001381973,-0.04065231596019389,-0.26788125267476703,-0.3718136576347111,-0.3489818212030989,-0.2438205735977817,-0.12182487479310988,-0.0359424151697491,-0.002789246900526843,0.00019865778200518717,0.01626871374031225,0.07979661440831039,0.1914615503670989,0.3115894402429671,0.3760334615921681,0.3275646734005709,0.14756928004139883,-0.1280544430825496,-0.41793663502550454,-0.6266831461371138,
      
    • Gives this: Waves
    • Need to write a generator that reads in text (words and characters) and produces data tables with stepsizes
    • Need to write a generator that takes an equation as a waveform
  • USPTO Meeting. Use NN to produce multiple centrality / laplacians that user interact with
  • Working on my 810 tasks
    • Potentially useful for mapmaking: Learning the Preferences of Ignorant, Inconsistent Agents
      • An important use of machine learning is to learn what people value. What posts or photos should a user be shown? Which jobs or activities would a person find rewarding? In each case, observations of people’s past choices can inform our inferences about their likes and preferences. If we assume that choices are approximately optimal according to some utility function, we can treat preference inference as Bayesian inverse planning. That is, given a prior on utility functions and some observed choices, we invert an optimal decision-making process to infer a posterior distribution on utility functions. However, people often deviate from approximate optimality. They have false beliefs, their planning is sub-optimal, and their choices may be temporally inconsistent due to hyperbolic discounting and other biases. We demonstrate how to incorporate these deviations into algorithms for preference inference by constructing generative models of planning for agents who are subject to false beliefs and time inconsistency. We explore the inferences these models make about preferences, beliefs, and biases. We present a behavioral experiment in which human subjects perform preference inference given the same observations of choices as our model. Results show that human subjects (like our model) explain choices in terms of systematic deviations from optimal behavior and suggest that they take such deviations into account when inferring preferences.
    • An Overview of the Schwartz Theory of Basic Values (Added to normative map making) Schwartz
      • This article presents an overview of the Schwartz theory of basic human values. It discusses the nature of values and spells out the features that are common to all values and what distinguishes one value from another. The theory identifies ten basic personal values that are recognized across cultures and explains where they come from. At the heart of the theory is the idea that values form a circular structure that reflects the motivations each value expresses. This circular structure, that captures the conflicts and compatibility among the ten values is apparently culturally universal. The article elucidates the psychological principles that give rise to it. Next, it presents the two major methods developed to measure the basic values, the Schwartz Value Survey and the Portrait Values Questionnaire. Findings from 82 countries, based on these and other methods, provide evidence for the validity of the theory across cultures. The findings reveal substantial differences in the value priorities of individuals. Surprisingly, however, the average value priorities of most societal groups exhibit a similar hierarchical order whose existence the article explains. The last section of the article clarifies how values differ from other concepts used to explain behavior—attitudes, beliefs, norms, and traits.

Phil 10.30.18

7:00 – 3:30 ASRC PhD

  • Search as embodies in the “Ten Blue Links” meets the requirements of a Parrow “Normal Accident”
    • The search results are densely connected. That’s how PageRank works. Even latent connections matter.
    • The change in popularity of a page rapidly affects the rank. So the connections are stiff
    • The relationships of the returned links both to each other and to the broader information landscape in general is hidden.
    • An additional density and stiffness issue is that everyone uses Google, so there is a dense, stiff connection between the search engine and the population of users
  • Write up something about how
    • ML can make maps, which decrease the likelihood of IR contributing to normal accidents
    • AI can use these maps to understand the shape of human belief space, and where the positive regions and dangerous sinks are.
  • Two measures for maps are the concepts or Range and length. Range is the distance that a trajectory can be placed on the map and remain contiguous. Length is the total distance that a trajectory travels, independent of the map its placed on.
  • Write up the basic algorithm of ML to map production
    • Take a set of trajectories that are known to be in the same belief region (why JuryRoom is needed) as the input
    • Generate an N-dimensional coordinate frame that best preserves length over the greatest range.
    • What is used as the basis for the trajectory may matter. The range (at a minimum), can go from letters to high-level topics. I think any map reconstruction based on letters would be a tangle, with clumps around TH, ER, ON, and AN. At the other end, an all-encompassing meta-topic, like WORDS would be a single, accurate, but useless single point. So the map reconstruction will become possible somewhere between these two extremes.
  • The Nietzsche text is pretty good. In particular, check out the way the sentences form based on the seed  “s when one is being cursed.
    • the fact that the spirit of the spirit of the body and still the stands of the world
    • the fact that the last is a prostion of the conceal the investion, there is our grust
    • the fact them strongests! it is incoke when it is liuderan of human particiay
    • the fact that she could as eudop bkems to overcore and dogmofuld
    • In this case, the first 2-3 words are the same, and random, semi-structured text. That’s promising, since the compare would be on the seed plus the generated text.
  • Today, see how fast a “Shining” (All work and no play makes Jack a dull boy.) text can be learned and then try each keyword as a start. As we move through the sentence, the probability of the next words should change.
    • Generate the text set
    • Train the Nietzsche model on the new text. Done. Here are examples with one epoch and a batch size of 32, with a temperature of 1.0:
      ----- diversity: 0.2
      ----- Generating with seed: "es jack a 
      dull boy all work and no play"
      es jack a 
      dull boy all work and no play makes jack a dull boy all work and no play makes jack a dull boy all work and no play makes jack a dull boy all work and no play makes 
      
      ----- diversity: 0.5
      ----- Generating with seed: "es jack a 
      dull boy all work and no play"
      es jack a 
      dull boy all work and no play makes jack a dull boy all work and no play makes jack a dull boy all work and no play makes jack a dull boy all work and no play makes 
      
      ----- diversity: 1.0
      ----- Generating with seed: "es jack a 
      dull boy all work and no play"
      es jack a 
      dull boy all work and no play makes jack a dull boy anl wory and no play makes jand no play makes jack a dull boy all work and no play makes jack a 
      
      ----- diversity: 1.2
      ----- Generating with seed: "es jack a 
      dull boy all work and no play"
      es jack a 
      dull boy all work and no play makes jack a pull boy all work and no play makes jack andull boy all work and no play makes jack a dull work and no play makes jack andull

      Note that the errors start with a temperature of 1.0 or greater

    • Rewrite the last part of the code to generate text based on each word in the sentence.
      • So I tried that and got gobbledygook. The issues is that the prediction only works on waveform-sized chunks. To verify this, I created a seed from the input text, truncating it to maxlen (20 in this case):
        sentence = "all work and no play makes jack a dull boy"[:maxlen]

        That worked, but it means that the character-based approach isn’t going to work

        ----- temperature: 0.2
        ----- Generating with seed: [all work and no play]
        all work and no play makes jack a dull boy all work and no play makes jack a dull boy all work and no play makes 
        
        ----- temperature: 0.5
        ----- Generating with seed: [all work and no play]
        all work and no play makes jack a dull boy all work and no play makes jack a dull boy all work and no play makes 
        
        ----- temperature: 1.0
        ----- Generating with seed: [all work and no play]
        all work and no play makes jack a dull boy all work and no play makes jack a dull boy pllwwork wnd no play makes 
        
        ----- temperature: 1.2
        ----- Generating with seed: [all work and no play]
        all work and no play makes jack a dull boy all work and no play makes jack a dull boy all work and no play makes


    • Based on this result and the ensuing chat with Aaron, we’re going to revisit the whole LSTM with numbers and build out a process that will support words instead of characters.
  • Looking for CMAC models, I found Self Organizing Feature Maps at NeuPy.com:
  • Here’s How Much Bots Drive Conversation During News Events
    • Late last week, about 60 percent of the conversation was driven by likely bots. Over the weekend, even as the conversation about the caravan was overshadowed by more recent tragedies, bots were still driving nearly 40 percent of the caravan conversation on Twitter. That’s according to an assessment by Robhat Labs, a startup founded by two UC Berkeley students that builds tools to detect bots online. The team’s first product, a Chrome extension called BotCheck.me, allows users to see which accounts in their Twitter timelines are most likely bots. Now it’s launching a new tool aimed at news organizations called FactCheck.me, which allows journalists to see how much bot activity there is across an entire topic or hashtag