
8:00 – 4:00 SR
- Possibly a good book to get? https://www.ng-book.com/
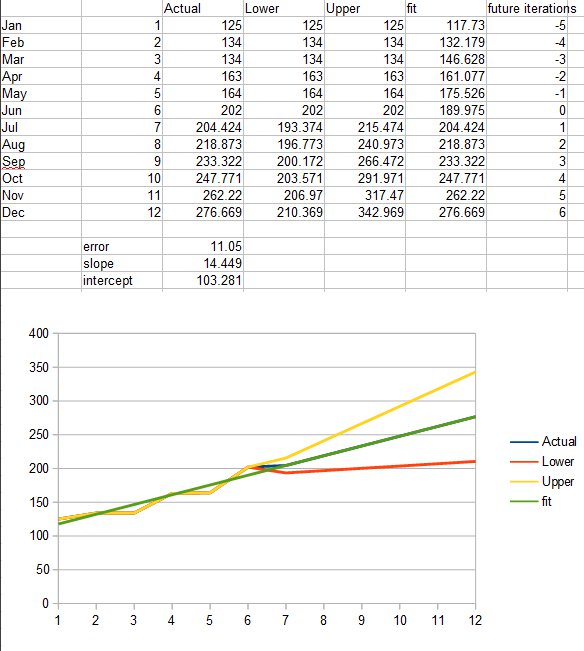
- Working on getting regression to predict upper and lower bounds
- Working out the structure of the dataFormat and dataProvider Objects
- dataFormat example
this.dataFormat = { // might add 2D/3d, dynamic/static, etc. goals: "area", obligations:"area", pm_actuals:"bar", facts:"bar", pm_future:"area", facts_future:"area" }; - Matching dataProvider example. Note the _mappings array and the fact that all items have a min/max value as well as a chart-wide minmax (no Z in this case)
this.dataProvider = { _type:'XY', // RAH (Radius Angle Height) RAE (Radius Azimuth Elevation), XYZ, etc. _min_max:{xmin:0.00, xmax:11.00, ymin:0.00, ymax:3135.30}, _mappings:[{Jan:0, Feb:1, Mar:2, Apr:3, May:4, Jun:5, Jul:6, Aug:7, Sep:8, Oct:9, Nov:10, Dec:11}], goals:{Jan:{min:0, max:1000.00}, Feb:{min:0, max:1100.00}, Mar:{min:0, max:1210.00}, Apr:{min:0, max:1331.00}, May:{min:0, max:1464.10}, Jun:{min:0, max:1610.51}, Jul:{min:0, max:1771.56}, Aug:{min:0, max:1948.72}, Sep:{min:0, max:2143.59}, Oct:{min:0, max:2357.95}, Nov:{min:0, max:2593.74}, Dec:{min:0, max:2853.12}}, obligations:{Jan:{min:0, max:500.00}, Feb:{min:0, max:600.00}, Mar:{min:0, max:720.00}, Apr:{min:0, max:864.00}, May:{min:0, max:1036.80}, Jun:{min:0, max:1244.16}, Jul:{min:0, max:1492.99}, Aug:{min:0, max:1791.59}, Sep:{min:0, max:2149.91}, Oct:{min:0, max:2579.89}, Nov:{min:0, max:3095.87}, Dec:{min:0, max:3715.04}}, pm_actuals:{Jan:{min:0, max:250.00}, Feb:{min:0, max:341.39}, Mar:{min:0, max:495.27}, Apr:{min:0, max:618.30}, May:{min:0, max:923.08}, Jun:{min:0, max:1318.68}}, facts:{Jan:{min:0, max:125.00}, Feb:{min:0, max:134.17}, Mar:{min:0, max:134.31}, Apr:{min:0, max:163.00}, May:{min:0, max:164.36}, Jun:{min:0, max:202.29}}, future_pm_actuals:{Jun:{min:1318.68, max:1318.68}, Jul:{min:1257.91, max:1499.96}, Aug:{min:1342.92, max:1827.03}, Sep:{min:1427.94, max:2154.10}, Oct:{min:1512.96, max:2481.16}, Nov:{min:1597.97, max:2808.23}, Dec:{min:1682.99, max:3135.30}}, future_facts:{Jun:{min:202.29, max:202.29}, Jul:{min:193.38, max:215.48}, Aug:{min:196.77, max:240.99}, Sep:{min:200.17, max:266.49}, Oct:{min:203.57, max:291.99}, Nov:{min:206.96, max:317.50}, Dec:{min:210.36, max:343.00}} }; - In excel, the results look like the following. Now working on incorporating into the graphing system
- Setting up a method to calculate the screen positions of the data points based on the dataProvider. Got margins, datagrids and areaCharts working. BarCharts are next. I need to think about how to cluster the bars. I’ll also need to add additional DataPoints when the botom axis is not (zero? horizontal?)


You must be logged in to post a comment.