
ASRC GEOS 7:00 – 3:00
- I’ve been thinking about the implications of this article: Training a single AI model can emit as much carbon as five cars in their lifetimes
- There is something in this that has to do with the idea of cost. NN architectures have no direct concept of cost. Inevitably the “current best network” takes a building full of specialized processors 200 hours. This has been true for Inception, AmeoebaNet, and AlphaGo. I wonder what would happen if there was a cost for computation that was part of the fitness function?
- My sense is that evolution, has two interrelated parameters
- a mutation needs to “work better” (whatever that means in the context) than the current version
- the organism that embodies the mutation has to reproduce
- In other words, neural structures in our brains have an unbroken chain of history to the initial sensor neurons in multicellular organisms. All the mutations that didn’t live to make an effect. Those that weren’t able to reproduce didn’t get passed on.
- Randomness is important too. Systems that are too similar, like Aspen trees that have given up on sexual reproduction and are essentially all clones reproducing by rhizome. These live long enough to have an impact on the environment, particularly where they can crowd out other species, but the species itself is doomed.
- I’d like to see an approach to developing NNs that involves more of the constraints of “natural” evolution. I think it would lead to better, and potentially less destructive results.
- SHAP (SHapley Additive exPlanations) is a unified approach to explain the output of any machine learning model. SHAP connects game theory with local explanations, uniting several previous methods [1-7] and representing the only possible consistent and locally accurate additive feature attribution method based on expectations (see our papers for details).
- Working on clustering. I’ve been going around in circles on how to take a set of relative distance measures and use them as a basis for clustering. To revisit, here’s a screenshot of a spreadsheet containing the DTW distances from every sequence to every other sequence:
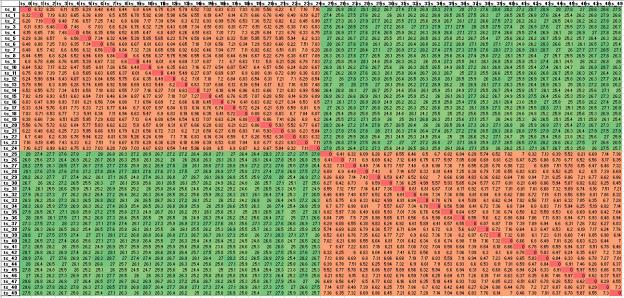
- My approach is to treat each line of relative distances as a high-dimensional coordinate ( in this case, 50 dimensions), and cluster with respect to the point that defines. This takes care of the problem that the data in this case is very symmetric about the diagonal. Using this approach, an orange/green coordinate is in a different location from the mirrored green/orange coordinate. It’s basically the difference between (1, 2) and (2, 1). That should be a reliable clustering mechanism. Here are the results:
       cluster_id
ts_0            0
ts_1            0
ts_2            0
ts_3            0
ts_4            0
ts_5            0
ts_6            0
ts_7            0
ts_8            0
ts_9            0
ts_10           0
ts_11           0
ts_12           0
ts_13           0
ts_14           0
ts_15           0
ts_16           0
ts_17           0
ts_18           0
ts_19           0
ts_20           0
ts_21           0
ts_22           0
ts_23           0
ts_24           0
ts_25           1
ts_26           1
ts_27           1
ts_28           1
ts_29           1
ts_30           1
ts_31           1
ts_32           1
ts_33           1
ts_34           1
ts_35           1
ts_36           1
ts_37           1
ts_38           1
ts_39           1
ts_40           1
ts_41           1
ts_42           1
ts_43           1
ts_44           1
ts_45           1
ts_46           1
ts_47           1
ts_48           1
ts_49           1
- First-Order Adversarial Vulnerability of Neural Networks and Input Dimension
- Carl-Johann Simon-Gabriel, Yann Ollivier, Bernhard Scholkopf, Leon Bottou, David Lopez-Paz
- Over the past few years, neural networks were proven vulnerable to adversarial images: Targeted but imperceptible image perturbations lead to drastically different predictions. We show that adversarial vulnerability increases with the gradients of the training objective when viewed as a function of the inputs. Surprisingly, vulnerability does not depend on network topology: For many standard network architectures, we prove that at initialization, the l1-norm of these gradients grows as the square root of the input dimension, leaving the networks increasingly vulnerable with growing image size. We empirically show that this dimension-dependence persists after either usual or robust training, but gets attenuated with higher regularization.
- More JASSS paper. Through the corrections up to the Results section. Kind of surprised to be leaning so hard on Homer, but I need a familiar story from before world maps.
- Oh yeah, the Age Of discovery correlates with the development of the Mercator projection and usable world maps
