
- Generations of political scientists have viewed the American constitutional system and its surrounding pluralist civil society as stable touchstones that safeguard against the threat of authoritarian leadership. Capitalizing on changes that go back several decades—the rise of nationalized polarization, the development of the unitary executive theory, and the growing sway of populist conservatives within the Republican Party—Donald Trump has demonstrated that the sources of countervailing power in the U.S. political system are far more fragile than previously understood. Trump has prevailed upon congressional Republicans to surrender their core constitutional responsibilities, has eviscerated critical foundations of the modern administrative state, and upended the relationship between the federal government and major civil society actors. Political scientists did not anticipate the potential for democratic breakdown that has emerged; we must now direct our energies to understanding this new constellation of power, as well as the pathways available for opponents to respond.
SBIRs
- 9:00 Standup – done
- 11:00 Phase2+ – done
- 4:00 MDA – done
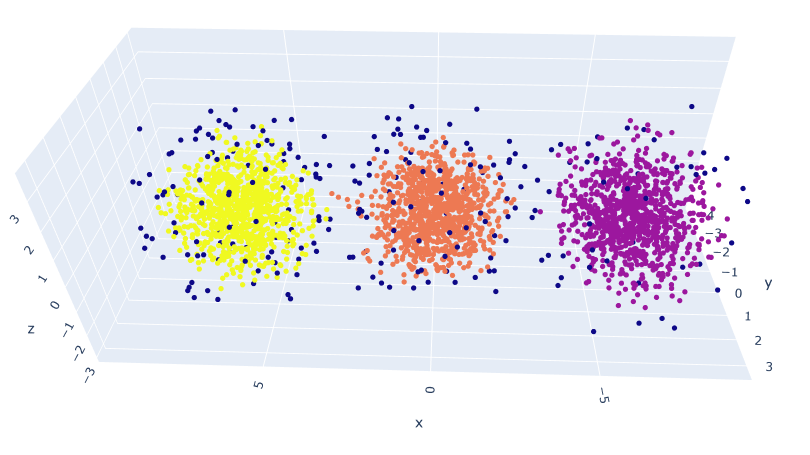
- Create walk sequences of cluster trajectories (ignore -1) and make an index2vec model. Let’s see what it looks like!
- Wrote a create_csv_from_story_embedding.py script that creates a walk sequence csv file and creates a model card
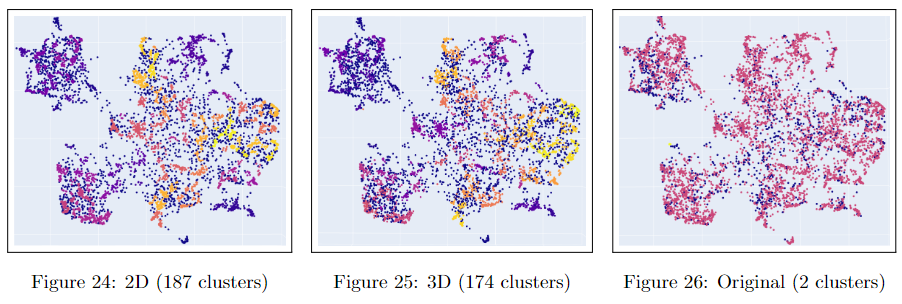
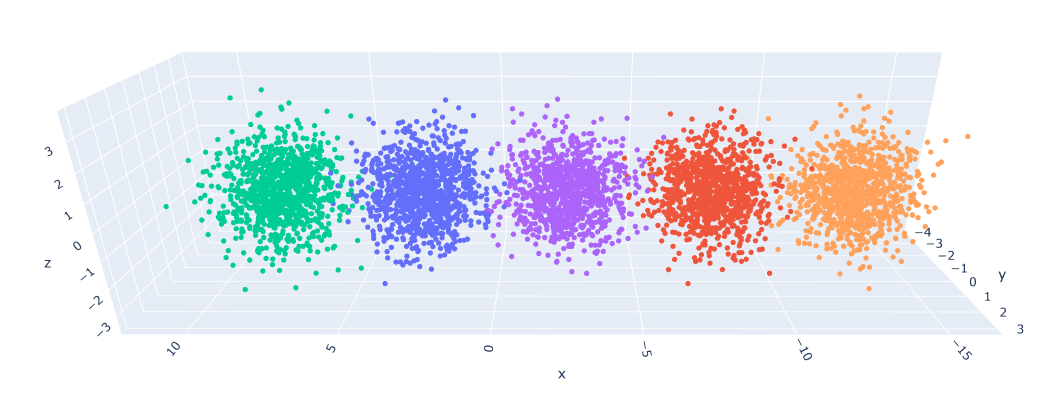
- Trained a 2D and 3D model!
- Got everything working! The embeddings are different than the topic embeddings. They appear to be more linear-ish. I think I need a good deal more data, because the 2D model seems to be better than the 3D. And multiple points are placed in the same coordinate. So 1) Try smaller clusters. That should give me 20% more data right there. And then generate more scenarios. Looking at Gutenberg just to see what-re-embedding means is also appropriate as a next step.


You must be logged in to post a comment.