Category Archives: Phil

Phil 4.22.15

8:00 – 2:00 SR

  • Still unable to access remote drives and no ticket. Sigh.
  • Still fixing svn.
  • Going to try to move the IChartGrid object to the base class and then inherit to create a new chart.

Phil 421.15

8:00 – 4:00 SR

  • Meeting with Dong, Lenny & Chris. Charts are the priority.
  • Working on migrating the chart grid to WegGlCharts.
  • Fixing subversion. Looks like the easiest thing to do is to copy over the old repo to the new one?
  • Tried copying, but the permissions were wrong. Trying this
    • svnadmin dump /path/to/repository > repository-name.dmp
    • svnadmin create repository-name [--fs-type fsfs] <-optional?
    • svnadmin load repository-name --force-uuid < repository-name.dmp
  • Finished moving over chartbg to WebGlCharts. Creating a chart now looks like this:
    var months:any = this.dataProvider.mappings[0];
    var charts:WglCharts.ConfiguredChart = new WglCharts.ConfiguredChart(rb, this.dataProvider, this.dataFormat);
    charts.setChartGrid(cg);
    charts.add2DCharts(months);

Phil 4.20.15

8:00 – 4:00 SR

  • Still having problems accessing my virtual drives from the server. Will try again tomorrow.
  • Moving common chart components to WebGlCharts.
  • Showed Dong how I’m getting server data
  • We also discussed unit testing. We’ll target the test code at the generated JavaScript, since we’re testing logic at that point.

4.17.15

7:00 – 3:00 SR

  • Deploy new FR fixes
  • Meeting with Lenny and Chris
  • Financial paperwork! Finished, though I had to go back a couple of times.
  • Since the charting is somewhat stable for the moment, I went back to improving the dbObjects to handle matrix operations.

Phil 4.16.15

8:00 – 2:00 SR

  • Charts are working. One really odd bug. The alert (blocking) dialog that pops up to notify non-hardware rendering is interfering with the render. There must be some kind of odd race condition. Removing it seems to fix?
  • Once the review charts are done, the next thing Lenny wants is the truancy reports. Then add Baseian prediction of those most likely to be late.
  • Installing software on new box
  • Got Skolded. Now what?

Phil 4.15.15

8:00 – 12:00 SR

  • My remote drives are not working on the servers any more. Put in a ticket
  • Fixed the Month1 != Month10 problem Dong found.
  • Was going to deploy the chart test but Bill had to leave. Maybe tomorrow.
  • Timesheets!

Phil 4.14.15

8:00 – 4:30 SR

  • FR seems to be running smoothly. Didn’t see Lenny.
  • Found a better linear regression class: http://commons.apache.org/proper/commons-math/apidocs/org/apache/commons/math3/stat/regression/SimpleRegression.html
  • Continuing to work on bars. Index and offset don’t seem to be working? Fixed.
  • Everything’s working. Now to automate the chart creation from the dataFormat and dataProvider.CombinedChart
  • Working out the interfaces for the format. This is helping a lot, particularly the ‘dictionary’ interface
  • Reworked the dataProvider and dataFormat interfaces and objects. This is now what it looks like:
  • DataFormat interface and example:
    export interface IChartElementFormat {
       label:string;
       objectName:string;
       type:string; // "area", "bar", pie, cluster
       hexColor:number;
    }
    
    export interface IChartFormat{
       [label:string]:IChartElementFormat;
    }
    
    this.dataFormat = { // might add 2D/3d, dynamic/static, etc.
       goals: {label:"Goals", objectName:"goals", type:"area", hexColor:0xFF0000},
       obligations:{label:"Obligations", objectName:"obligations",  type:"area",hexColor:0xFFFF00},
       pm_actuals:{label:"PM Actuals", objectName:"pm_actuals",  type:"bar",hexColor:0x00FF00},
       facts:{label:"Facts", objectName:"facts",  type:"bar",hexColor:0x0000FF},
       future_pm_actuals:{label:"Future PMA", objectName:"future_pm_actuals",  type:"area",hexColor:0xAAFFAA},
       future_facts:{label:"Future FACTS", objectName:"future_facts",  type:"area", hexColor:0xAAAAFF}
    };
  • DataProvider interfaces:
    export interface IChartBoundries {
       xmin:number;
       xmax:number;
       ymin:number;
       ymax:number;
       zmin?:number;
       zmax?:number;
    }
    
    export interface IChartDataMapping{
       [label:string]:number;
    }
    
    export interface IMinMax {
       min:number;
       max:number;
    }
    
    export interface IChartDataElement{
       [label:string]:IMinMax;
    }
    
    export interface IChartDataCollection{
       [objectName:string]:IChartDataElement;
    }
    
    export interface IChartData{
       type:string;
       min_max:IChartBoundries;
       mappings:IChartDataMapping[];
       data:IChartDataCollection;
    }
  • DataProvider example:
    this.dataProvider = {
       type:'XY', // RAH (Radius Angle Height) RAE (Radius Azimuth Elevation), XYZ, etc.
       min_max:{xmin:0.00, xmax:11.00, ymin:0.00, ymax:3715.30},
       mappings:[{Jan:0, Feb:1, Mar:2, Apr:3, May:4, Jun:5, Jul:6, Aug:7, Sep:8, Oct:9, Nov:10, Dec:11}],
       data:{
          goals: {
             Jan: {min: 0, max: 1000.00},
             Feb: {min: 0, max: 1100.00},
             Mar: {min: 0, max: 1210.00},
             Apr: {min: 0, max: 1331.00},
             May: {min: 0, max: 1464.10},
             Jun: {min: 0, max: 1610.51},
             Jul: {min: 0, max: 1771.56},
             Aug: {min: 0, max: 1948.72},
             Sep: {min: 0, max: 2143.59},
             Oct: {min: 0, max: 2357.95},
             Nov: {min: 0, max: 2593.74},
             Dec: {min: 0, max: 2853.12}
          },
          obligations: {
             Jan: {min: 0, max: 500.00},
             Feb: {min: 0, max: 600.00},
             Mar: {min: 0, max: 720.00},
             Apr: {min: 0, max: 864.00},
             May: {min: 0, max: 1036.80},
             Jun: {min: 0, max: 1244.16},
             Jul: {min: 0, max: 1492.99},
             Aug: {min: 0, max: 1791.59},
             Sep: {min: 0, max: 2149.91},
             Oct: {min: 0, max: 2579.89},
             Nov: {min: 0, max: 3095.87},
             Dec: {min: 0, max: 3715.04}
          },
          pm_actuals: {
             Jan: {min: 0, max: 250.00},
             Feb: {min: 0, max: 341.39},
             Mar: {min: 0, max: 495.27},
             Apr: {min: 0, max: 618.30},
             May: {min: 0, max: 923.08},
             Jun: {min: 0, max: 1318.68}
          },
          facts: {
             Jan: {min: 0, max: 125.00},
             Feb: {min: 0, max: 134.17},
             Mar: {min: 0, max: 134.31},
             Apr: {min: 0, max: 163.00},
             May: {min: 0, max: 164.36},
             Jun: {min: 0, max: 202.29}
          },
          future_pm_actuals: {
             Jun: {min: 1318.68, max: 1318.68},
             Jul: {min: 1257.91, max: 1499.96},
             Aug: {min: 1342.92, max: 1827.03},
             Sep: {min: 1427.94, max: 2154.10},
             Oct: {min: 1512.96, max: 2481.16},
             Nov: {min: 1597.97, max: 2808.23},
             Dec: {min: 1682.99, max: 3135.30}
          },
          future_facts: {
             Jun: {min: 202.29, max: 202.29},
             Jul: {min: 193.38, max: 215.48},
             Aug: {min: 196.77, max: 240.99},
             Sep: {min: 200.17, max: 266.49},
             Oct: {min: 203.57, max: 291.99},
             Nov: {min: 206.96, max: 317.50},
             Dec: {min: 210.36, max: 343.00}
          }
       }
    };
  • Need to place the dataProvider in the html to see if it works there.

Phil 4.13.15

8:00 – 5:00 SR

  • Figured out Bayes Theorem and got some spreadsheet examples working over the weekend. It’s effective and appropriate.
  • Started modifying DBTypedTable to handle tables that are created by sequential calls to the DB. Basically a way of making mode sophisticated joins.
  • Adding items into the 2Dchart test.
  • All full area charts work.
  • Need to get area charts that only cover part of the chart working. Done
  • Need to add DataPoints to the bottom of area charts that are not zero. Done
  • Need to add clustered bars, based on the number of where the bar is in the order of the dataFormat object.
  • Need to throw an event (or do something similar) when an items is clicked.

Phil 4.10.15

8:00 – 4:00 SR

  • Possibly a good book to get? https://www.ng-book.com/
  • Working on getting regression to predict upper and lower bounds
  • Working out the structure of the dataFormat and dataProvider Objects
  • dataFormat example
    this.dataFormat = { // might add 2D/3d, dynamic/static, etc.
       goals: "area",
       obligations:"area",
       pm_actuals:"bar",
       facts:"bar",
       pm_future:"area",
       facts_future:"area"
    };
  • Matching dataProvider example. Note the _mappings array and the fact that all items have a min/max value as well as a chart-wide minmax (no Z in this case)
    this.dataProvider = {
       _type:'XY', // RAH (Radius Angle Height) RAE (Radius Azimuth Elevation), XYZ, etc.
       _min_max:{xmin:0.00, xmax:11.00, ymin:0.00, ymax:3135.30},
       _mappings:[{Jan:0, Feb:1, Mar:2, Apr:3, May:4, Jun:5, Jul:6, Aug:7, Sep:8, Oct:9, Nov:10, Dec:11}],
       goals:{Jan:{min:0, max:1000.00}, Feb:{min:0, max:1100.00}, Mar:{min:0, max:1210.00}, Apr:{min:0, max:1331.00}, May:{min:0, max:1464.10}, Jun:{min:0, max:1610.51}, Jul:{min:0, max:1771.56}, Aug:{min:0, max:1948.72}, Sep:{min:0, max:2143.59}, Oct:{min:0, max:2357.95}, Nov:{min:0, max:2593.74}, Dec:{min:0, max:2853.12}},
       obligations:{Jan:{min:0, max:500.00}, Feb:{min:0, max:600.00}, Mar:{min:0, max:720.00}, Apr:{min:0, max:864.00}, May:{min:0, max:1036.80}, Jun:{min:0, max:1244.16}, Jul:{min:0, max:1492.99}, Aug:{min:0, max:1791.59}, Sep:{min:0, max:2149.91}, Oct:{min:0, max:2579.89}, Nov:{min:0, max:3095.87}, Dec:{min:0, max:3715.04}},
       pm_actuals:{Jan:{min:0, max:250.00}, Feb:{min:0, max:341.39}, Mar:{min:0, max:495.27}, Apr:{min:0, max:618.30}, May:{min:0, max:923.08}, Jun:{min:0, max:1318.68}},
       facts:{Jan:{min:0, max:125.00}, Feb:{min:0, max:134.17}, Mar:{min:0, max:134.31}, Apr:{min:0, max:163.00}, May:{min:0, max:164.36}, Jun:{min:0, max:202.29}},
       future_pm_actuals:{Jun:{min:1318.68, max:1318.68}, Jul:{min:1257.91, max:1499.96}, Aug:{min:1342.92, max:1827.03}, Sep:{min:1427.94, max:2154.10}, Oct:{min:1512.96, max:2481.16}, Nov:{min:1597.97, max:2808.23}, Dec:{min:1682.99, max:3135.30}},
       future_facts:{Jun:{min:202.29, max:202.29}, Jul:{min:193.38, max:215.48}, Aug:{min:196.77, max:240.99}, Sep:{min:200.17, max:266.49}, Oct:{min:203.57, max:291.99}, Nov:{min:206.96, max:317.50}, Dec:{min:210.36, max:343.00}}
    };
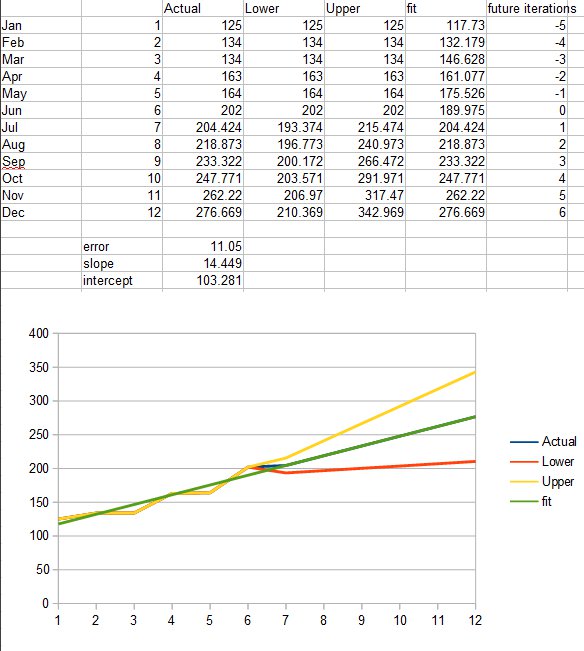
  • In excel, the results look like the following. Now working on incorporating into the graphing system prediction
  • Setting up a method to calculate the screen positions of the data points based on the dataProvider. Got margins, datagrids and areaCharts working. BarCharts are next. I need to think about how to cluster the bars. I’ll also need to add additional DataPoints when the botom axis is not (zero? horizontal?)

Phil 4.9.15

8:00 – 4:30 SR

  • Showed Lenny the new charts. He’ll be out tomorrow, so I’ll probably deploy the test version on Monday. We then had a long talk about the best way to statistically model the data in the first chart. It really sounds like Bayes might be the way to do this. Which is awesomely cool, because my schoolwork and jobwork are perfectly aligned for the weekend. Gonna charge me some hours figuring out Bayes.
  • Building the dataFormat and dataProvider Objects. Since Lenny wants future performance, I’m pulling in the Apache commons math jar for linear regression. I think I want OLSMultipleLinearRegression
  • Added SimpleLinearRegression to JavaUtils that wraps OLSMultipleLinearRegression and hides some complexity.that is not intuitively obvious documentation. Glad I found this example. Added to Subversion. I’ll probably need to add a method that gets the error so that I can add that to the future error.
  • More JSON tomorrow, then on to Bayes. Did get this book

Phil 4.8.15

8:00 – 4:00 SR

  • Kinda promised Ronda cookies
  • Worked through Markov Chain Matrix math. I think I understand how it relates to PageRank Matrix math, and therefore, how Page Rank is a Markov Chain.
  • Working through charting bugs
    • Added font and color choice to dprint
    • Fixed canvas font application in WebGlComponentClasses
    • Updated WebGlInterfaces
    • Fixed bugs in ChartInfo
  • Newest version is live
  • Adding JSON objects for charts to read and display.

Phil 4.7.15

8:00 – 4:00 SR

  • Committed to bringing in a test version of the charting. I probably need a WGLChart2D so that there’s no DB complications initially. Need to verify that the JSON servlet still works though.
  • Added legends back in. Had to fix a bad string test
  • The CanvasRenderer moved. Had to fix that. Verified it still works
  • Removing chart classes from the controller and putting them in the classes folder
  • Added WebGlCharts to classes directory and to the makefile. Had problems until I realized that I had created “WegGlCharts”. Stupid fingers.
  • Starrting WGLChart2D
  • My new dev box is here!
  • 2D is mostly ported and running. A few more things to clean up before packaging to deploy. Visible here.

Phil 4.2.15

8:00 – 5:00 SR

  • Had to bounce the server
  • Status reports! Done.
  • Going to revisit the dynamic creation of callback functions to see if I can get it to work with Angular. If that fails I’m giving up and going back to interfaces. I expect Angular 2.0 to fix this problem anyway.
  • This works:
    export class ATSBase {
       constructor() {
          /****/
          this["timeoutFunction"] = () => {
             var proto:Object = this["__proto__"];
             proto["timeoutFunction"].apply(this, arguments);
          };
    
          this["myFunction"] = () => {
             var proto:Object = this["__proto__"];
             proto["myFunction"].apply(this, arguments);
          };
          console.log("done");
          /****/
       }
    }
  • This does not:
    class Base {
       constructor() {
          for (var p in this)
             if (!Object.prototype.hasOwnProperty.call(this, p) && typeof this[p] == 'function') {
                var method = this[p];
                this[p] = () => { method.apply(this, arguments); };
                // (make a prototype method bound to the instance)
             }
       }
    }
  • If I figure out that, I think I’ve got it…

Phil 3.31.15

8:00 – 4:30 SR

  • Working on debugging POC name issue. Fixed? Had to roll back some things to make the data binding work?
  • Migrating NovettaUtils to the lib directory, then using that for inheriting in the charts module. Which was going to be migrated before discovering the fat arrow inherit feature (FAIF). So yeah. migrate that too.
  • Nope, realized that there was no way to maintain state using the approach that I tried. Looking into using the actual prototype chaining pattern instead.
  • Ok, kinda hit a wall here. Note that the breakpoint and the console.log disagree:

wtf

Phil 3.30.15

8:00 – 3:00 SR

  • Mark, who is standing in for Lenny, found this and I verified. Entering a POC in a new FR doesn’t show up in the list.
  • Testing the new callback scheme in typescript testbed.
  • Tried it, and was quite hopeful, but the scheme failed with the timeoutService callback. Bad, because that’s a basic Angular component and messing with that just isn’t in the cards. But the fatPrototype/fatSuper scheme works. Now I just need to be able to make prototype chaining work right. Done! Here’s the entire class:
    export class FatSuperBase {
       public functionMap:any[];
       constructor() {
          this.functionMap = [];
       }
       public setFatPrototype(fn:Function, n:string){
          // TODO: look for earlier prototypes that we might need to call
          if(!this.functionMap.hasOwnProperty(n)){
             this.functionMap[n] = [];
          }
          this.functionMap[n].push(fn);
       }
       public fatSuper(fnName:string, childArgs:IArguments){
          // TODO: look for earlier prototypes that we might need to call
          var fn:Function;
          var farray:Function[];
          if(this.functionMap.hasOwnProperty(fnName)){
             farray = this.functionMap[fnName];
             fn = farray[farray.length-1];
             fn.apply(fn, childArgs);
          }else{
             console.log("fatSuper(): function '"+fnName+"'does not exist on the prototype chain");
          }
       }
    }