Author Archives: pgfeldman

Phil 3.9.17

7:00 – 7:30, 4:00-5:30  Research

9:30 – 3:30BRC

  • Neat thing from Flickr on finding similar images.
  • How to install pyLint as an external tool in IntelliJ.
  •  How to find out where your python modules are installed:
    C:\Windows\system32>pip3 show pylint
    Name: pylint
    Version: 1.6.5
    Summary: python code static checker
    Home-page: https://github.com/PyCQA/pylint
    Author: Python Code Quality Authority
    Author-email: code-quality@python.org
    License: GPL
    Location: c:\users\philip.feldman\appdata\local\programs\python\python35\lib\site-packages
    Requires: colorama, mccabe, astroid, isort, six
  • Looking at building scikit DBSCAN clusterer. I think the plan will be to initially use TF as IO. read in the protobuf and eval() out the matrix to scikit. Do the clustering in scikit, and then use TF to write out the results. Since TF and scikit are very similar, that should aid in the transfer from Python to TF, while allowing for debugging and testing in the beginning. And we can then benchmark.
  • Working on running the scikit.learn plot_dbscan example, and broke the scipy install. Maybe use the Windows installers? Not sure what that might break. Will try again and follow error messages first.
  • This looks like the fix: http://stackoverflow.com/questions/28190534/windows-scipy-install-no-lapack-blas-resources-found
    • Sorry to necro, but this is the first google search result. This is the solution that worked for me:
      1. Download numpy+mkl wheel from http://www.lfd.uci.edu/~gohlke/pythonlibs/#numpy. Use the version that is the same as your python version (check using python -V). Eg. if your python is 3.5.2, download the wheel which shows cp35
      2. Open command prompt and navigate to the folder where you downloaded the wheel. Run the command: pip install [file name of wheel]
      3. Download the SciPy wheel from: http://www.lfd.uci.edu/~gohlke/pythonlibs/#scipy (similar to the step above).
      4. As above, pip install [file name of wheel]
  • got a new error where
    TypeError: unorderable types: str() < int()
    • After some searching, here’s the SO answer
    • Changed line 406 from fixes.py from:
      if np_version < (1, 12, 0):

      into

      if np_version < (1, 12):
    • Success!!! DBSCAN_cluster_test
  • Sprint Review

Phil 3.8.17

7:00 – 8:00 Research

  • Tweaking the Sunstein letter
  • Trying to decide what to do next. There is a good deal of work that can be done in the model, particularly with antibelief. Totalitarianism may actually go further?
    • Arendt says:The advantages of a propaganda that constantly “adds the power of organization”[58] to the feeble and unreliable voice of argument, and thereby realizes, so to speak, on the spur of the moment, whatever it says, are obvious beyond demonstration. Foolproof against arguments based on a reality which the movements promised to change, against a counterpropaganda disqualified by the mere fact that it belongs to or defends a world which the shiftless masses cannot and will not accept, it can be disproved only by another, a stronger or better, reality.
      • [58] Hadamovsky, op. cit., p. 21. For totalitarian purposes it is a mistake to propagate their ideology through teaching or persuasion. In the words of Robert Ley, it can be neither “taught” nor “learned,” but only “exercised” and “practiced” (see Der Weg zur Ordensburg, undated).
    • On the same page: The moment the movement, that is, the fictitious world which sheltered them, is destroyed, the masses revert to their old status of isolated individuals who either happily accept a new function in a changed world or sink back into their old desperate superfluousness. The members of totalitarian movements, utterly fanatical as long as the movement exists, will not follow the example of religious fanatics and die the death of martyrs (even though they were only too willing to die the death of robots). [59]
      • [59] R. Hoehn, one of the outstanding Nazi political theorists, interpreted this lack of a doctrine or even a common set of ideals and beliefs in the movement in his Reichsgemeinschaft and Volksgeme’mschaft, Hamburg, 1935: “From the point of view of a folk community, every community of values is destructive”
  • This implies that there a stage where everything outside the cluster is attacked and destroyed, rather than avoided. So there’s actually four behaviors: Explore, Confirm, Avoid, and something like Lie/Destroy/Adhere. This last option cuts the Gordian Knot of game theory – its premise of making decisions with incomplete information – by substituting self-fulfilling fictional information that IS complete. And here, diversity won’t help. It literally is the enemy.
  • And this is an emergent phenomenon. From Konrad Heiden’s Der Führer. Hitler’s Rise to Power: Propaganda is not “the art of instilling an opinion in the masses. Actually it is the art of receiving an opinion from the masses.”  

8:30 – 6:00 BRC

  • Figured out part of my problem. The native python math is sloooooow. Using numpy makes everything acceptably fast. I’m not sure if I’m doing anything more than calculating in numpy and then sticking the result in TensorFlow, but it’s a start. Anyway, here’s the working code:
    import time
    import numpy as np
    import tensorflow as tf
    
    def calcL2Dist(t1, t2):
        sub = np.subtract(t1, t2)
        squares = np.square(sub)
        dist = np.sum(squares)
        return dist
    
    def createCompareMat(sourceMat, rows):
        resultMat = np.zeros([rows, rows])
        for i in range(rows):
            for j in range(rows):
                if i != j:
                    t1 = sourceMat[i]
                    t2 = sourceMat[j]
                    dist = calcL2Dist(t1, t2)
                    resultMat[i, j] = dist
        return resultMat
    
    def createSequenceMatrix(rows, cols, scalar=1.0):
        mat = np.zeros([rows, cols])
        for i in range(rows):
            for j in range(cols):
                val = (i+1)*10 + j
                mat[i, j] = val * scalar
        return mat
    
    for t in range(5, 8):
        side = (t*100)
    
        sourceMat = createSequenceMatrix(side, side)
    
        resultMat = tf.Variable(sourceMat) # Use variable
    
        start = time.time()
        with tf.Session() as sess:
            tf.global_variables_initializer().run() # need to initialize all variables
    
            distMat = createCompareMat(sourceMat=sourceMat, rows=side)
    
            resultMat.assign(distMat).eval()
            result = resultMat.eval()
            #print('modified resultMat:\n', result)
            #print('modified sourceMat:\n', sourceMat)
        stop = time.time()
        duration = stop-start
        print("{0} cells took {1} seconds".format(side*side, duration))
  • Working on the Sprint review. I think we’re in a reasonably good place. We can do our clustering using scikit, at speeds that are acceptable even on my laptop. Initially, we’ll use TF mostly for transport between systems, and then backfill capability.
  • This is really important for the Research Browser concept:

Phil 3.7.17

7:00 – 8:00 Research

  • The meeting with Don went well. We’re going to submit to Physical Review E. I need to fix a chart and then we need to make the paper more ‘Math-y’
  • Creating a copy of the paper for PRE – done
  • Fix the whisker chart – done
  • Compose a letter to Cass Sunstein asking for his input. Drafted. Getting sanity checks
  • On Building a “Fake News” Classification Model

8:30 – 6:00 BRC

  • Ran into an unexpected problem, the creation of the TF graph for my dictionary is taking exponential time to construct. SAD!
  • Debugging TF slides. Includes profiler. Pick up here tomorrow

Phil 3.6.17

6:30 – 7:00 , 4:00 – 6:00 Research

7:30 – 3:30, BRC

  • From LearningTensorflow.com: KMeans tutorial. Looks pretty good
  • This looks interesting: Large-Scale Evolution of Image Classifiers: Neural networks have proven effective at solving difficult problems but designing their architectures can be challenging, even for image classification problems alone. Evolutionary algorithms provide a technique to discover such networks automatically. Despite significant computational requirements, we show that evolving models that rival large, hand-designed architectures is possible today. We employ simple evolutionary techniques at unprecedented scales to discover models for the CIFAR-10 and CIFAR-100 datasets, starting from trivial initial conditions. To do this, we use novel and intuitive mutation operators that navigate large search spaces. We stress that no human participation is required once evolution starts and that the output is a fully-trained model.
  • Working on calculating distance between two vectors. Oddly, these do not seem to be library functions. This seems to be the way to do it:
    def calcL2Dist(t1, t2):
        dist = -1.0
        sub = tf.subtract(t1, t2)
        squares = tf.square(sub)
        sum = tf.reduce_sum(squares)
        return sum
  • Now I’m trying to build a matrix of distances. Got it working after some confusion. Here’s the full code. Note that the ‘source’ matrix is declared as a constant, since it’s immutable(?)
    import numpy as np
    import tensorflow as tf;
    
    def calcL2Dist(t1, t2):
        dist = -1.0
        sub = tf.subtract(t1, t2)
        squares = tf.square(sub)
        dist = tf.reduce_sum(squares)
        return dist
    
    def initDictRandom(rows = 3, cols = 5, prefix ="doc_"):
        dict = {}
        for i in range(rows):
            name = prefix+'{0}'.format(i)
            dict[name] = tf.Variable(np.random.rand(cols), tf.float32)
        return dict
    
    def initDictSeries(rows = 3, cols = 5, offset=1, prefix ="doc_"):
        dict = {}
        for i in range(rows):
            name = prefix+'{0}'.format(i)
            array = []
            for j in range(cols):
                array.append ((i+offset)*10 + j)
            #dict[name] = tf.Variable(np.random.rand(cols), tf.float32)
            dict[name] = tf.constant(array, tf.float32)
        return dict
    
    def createCompareDict(sourceDict):
        distCompareDict = {}
        keys = sourceDict.keys();
        for n1 in keys:
            for n2 in keys:
                if n1 != n2:
                    name = "{0}_{1}".format(n1, n2)
                    t1 = sourceDict[n1]
                    t2 = sourceDict[n2]
                    dist = calcL2Dist(t1, t2)
                    distCompareDict[name] = tf.Variable(dist, tf.float32)
        return distCompareDict
    
    sess = tf.InteractiveSession()
    dict = initDictSeries(cols=3)
    dict2 = createCompareDict(dict)
    init = tf.global_variables_initializer()
    sess.run(init)
    
    
    print("{0}".format(sess.run(dict)).replace("),", ")\n"))
    print("{0}".format(sess.run(dict2)).replace(",", "])\n"))
  • Results:
    {'doc_0': array([ 10.,  11.,  12.], dtype=float32)
     'doc_2': array([ 30.,  31.,  32.], dtype=float32)
     'doc_1': array([ 20.,  21.,  22.], dtype=float32)}
    {'doc_1_doc_2': 300.0])
     'doc_0_doc_2': 1200.0])
     'doc_1_doc_0': 300.0])
     'doc_0_doc_1': 300.0])
     'doc_2_doc_1': 300.0])
     'doc_2_doc_0': 1200.0}
  • Looks like the data structures that are used in the tutorials are all using panda.
    • Successfully installed pandas-0.19.2

Phil 3.4.17

Phil 3.3.17

7:00 – 8:00 Research

  • Finished formats and determine requirements for journals. Here’s the blog entry with all the information

8:30 – 4:00 BRC

  • CS231n: Convolutional Neural Networks for Visual Recognition (Stanford)
  • So this is going to seem very newbie, but I’ve finally figured out how to populate a dictionary of arrays:
    import numpy as np
    
    dict = {'doc1':[], 'doc2':[], 'doc3':[]}
    
    for doc in dict:
        dict[doc] = np.random.rand(5)
    
    for doc in dict:
        print("{0}: {1}".format(doc, dict[doc]))
    • It turns out that you HAVE to set the array relationship when the key is defined. Here’s how you do it programmatically
      import numpy as np
      
      dict = {}
      
      for i in range(5):
          name = 'doc_{0}'.format(i)
          dict[name] = np.random.rand(5)
      
      for doc in dict:
          print("{0}: {1}".format(doc, dict[doc]))
    • Which gives the following results
      doc_0: [ 0.53396248  0.10014123  0.40849079  0.76243954  0.29396581]
      doc_2: [ 0.21438903  0.68745032  0.1640486   0.51779412  0.05844617]
      doc_1: [ 0.36181216  0.78839326  0.90174006  0.29013203  0.76752794]
      doc_3: [ 0.44230569  0.63054045  0.80872794  0.83048027  0.87243106]
      doc_4: [ 0.08283319  0.72717925  0.29242797  0.90089588  0.34012144]
  • Continuing to walk through fully_connected.py along with the tutorial
    • math_ops.py – TF doc looks very handy
    • gen_nn_ops.py – TF doc looks like the rest of the coed we’ll need
    • ReLU. The Rectified Linear Unit has become very popular in the last few years. It computes the function f(x)=max(0,x)”>f(x)=max(0,x)f(x)=max(0,x). In other words, the activation is simply thresholded at zero (see image above on the left). There are several pros and cons to using the ReLUs: (Def from here)
  • Discovered the Large-Scale Linear Model tutorial. It looks similar-ish to clustering. These are some of the features in tf.contrib.learn, which is also the home of the kmeans clusterer
    • Feature columns and transformations

      Much of the work of designing a linear model consists of transforming raw data into suitable input features. tf.learn uses the FeatureColumn abstraction to enable these transformations.

      A FeatureColumn represents a single feature in your data. A FeatureColumn may represent a quantity like ‘height’, or it may represent a category like ‘eye_color’ where the value is drawn from a set of discrete possibilities like {‘blue’, ‘brown’, ‘green’}.

      In the case of both continuous features like ‘height’ and categorical features like ‘eye_color’, a single value in the data might get transformed into a sequence of numbers before it is input into the model. The FeatureColumn abstraction lets you manipulate the feature as a single semantic unit in spite of this fact. You can specify transformations and select features to include without dealing with specific indices in the tensors you feed into the model.

    • WOOHOO! Found what I was looking for! 
      • The input function must return a dictionary of tensors. Each key corresponds to the name of a FeatureColumn. Each key’s value is a tensor containing the values of that feature for all data instances. See Building Input Functions with tf.contrib.learn for a more comprehensive look at input functions, and input_fn in the linear models tutorial code for an example implementation of an input function.
      • So, working with that assumption, here’s a dictionary of tensors.
        import numpy as np
        import tensorflow as tf;
        
        sess = tf.Session()
        
        dict = {}
        
        for i in range(5):
            name = 'doc_{0}'.format(i)
            var = tf.Variable(np.random.rand(5), tf.float32)
            dict[name] = var
        
        init = tf.global_variables_initializer()
        sess.run(init)
        
        print("{0}".format(sess.run(dict)).replace("]),", "])\n"))
      • Which, remarkably enough, runs and produces the following!
        {'doc_2': array([ 0.17515295,  0.93597391,  0.38829954,  0.49664442,  0.07601639])
         'doc_0': array([ 0.40410072,  0.24565424,  0.9089159 ,  0.02825472,  0.28945943])
         'doc_1': array([ 0.060302  ,  0.58108026,  0.21500697,  0.40784728,  0.89955796])
         'doc_4': array([ 0.42359652,  0.0212912 ,  0.38216499,  0.5089103 ,  0.5616441 ])
         'doc_3': array([ 0.41851737,  0.76488499,  0.63983758,  0.17332712,  0.07856653])}

Phil 3.2.17

7:00 – 8:00 Research

  • Scheduled a meeting with Don for Monday at 4:00
  • Working on finding submission formats for my top 3
    • Physical Review E
      • Author page
      • Here’s the format
        • My guess is that there will have to be equations for neighbor calculation (construct a vector from visible neighbors and slew heading and speed) plus maybe a table for the figure 8? Not sure how to do that since the populations had no overlap.
      • Length FAQ Looks like 4500 words
        Rapid Communication 4500 words
        Comment / Reply 3500 words
      • Include:
        • Any text in the body of the article
        • Any text in a figure caption or table caption
        • Any text in a footnote or an endnote
        • I’m at 3073 words in the content.
        • Here’s the figure word eqivalents:
          figure xsize ysize aspect one col two cols
          10 6.69 4.03 1.66 110.26 401.04
          9 8.13 2.85 2.85 72.56 250.24
          8 6.28 5.14 1.22 142.79 531.14
          7 8.78 2.94 2.98 70.31 241.23
          6 6.64 3.97 1.67 109.74 398.97
          5 6.80 3.89 1.75 105.79 383.15
          4 8.13 2.85 2.85 72.56 250.24
          3 8.13 2.85 2.85 72.56 250.24
          2 8.13 2.85 2.85 72.56 250.24
          1 7.26 5.44 1.33 132.40 489.59
          961.52 3446.08
        • So it looks like the word count is between 4,034 and 6,519
      • IEEE Transactions on Automatic Control
        • Instructions for full papers
          • PDF
          • Manuscript style is in section C. References are like ACM
          • Normally 12 pages and no more than 16
          • A mandatory page charge is imposed on all accepted full papers exceeding 12 Transactions formatted pages including illustrations, biographies and photos . The charge is $125 per page for each page over the first 12 pages and is a prerequisite for publication. A maximum of 4 such additional pages (for a total of 16 pages) is allowed. 
          • Note that the authors will be asked to submit a single-column double-spaced version of their paper as well, under Supplementary Materials
          • To enhance the appearance of your paper on IEEEXplore®, a Graphical Abstract can be displayed along with traditional text. The Graphical Abstract should provide a clear, visual summary of your paper’s findings by means of an image, animation, video, or audio clip. NOTE: The graphical abstract is considered a part of the technical content of the paper, and you must provide it for peer review during the paper submission process.
        • Submission policy
        • MSWord template and Instructions on How to Create Your Paper
        • Guidelines for graphics and charts
      • Journal of Political Philosophy (Not sure if it makes sense, but this was where The Law of Group Polarization was published)
        • Author Guidelines 
        • Manuscripts accepted for publication must be put into JPP house style, as follows:
          • SPELLING AND PUNCTUATION: Authors may employ either American or English forms, provided that style is used consistently throughout their submission.
          • FOOTNOTES: Should be numbered consecutively. Authors may either:
            • employ footnotes of the traditional sort, containing all bibliographic information within them; or else
            • collect all bibliographic information into a reference list at the end of the article, to which readers should be referred by footnotes (NOT in-text reference) of the form ‘Barry 1965, p. 87’.
          • BIBLIOGRAPHIC INFORMATION: should be presented in either of the following formats:
            • If incorporated into the footnotes themselves:
              Jürgen Habermas, Legitimation Crisis, trans. Thomas McCarthy (London: Heinemann, 1976), p. 68.
              Louise Antony, ‘The socialization of epistemology’, Oxford Handbook of Contextual Political Analysis, ed. by Robert E. Goodin and Charles Tilly (Oxford: Oxford University Press, 2006, pp.58-77, at p. 62.
              John Rawls ‘Justice as fairness’, Philosophical Review, 67 (1958), 164-94 at p. 185.
            • If collected together in a reference list at the end of the article:
              Habermas, Jurgen. 1976. Legitimation Crisis, trans. Thomas McCarthy. London: Heinemann.
              Antony, Louise. 2006. The socialization of epistemology. Pp. 58-77 in Oxford Handbook of Contextual Political Analysis, ed. by Robert E. Goodin and Charles Tilly. Oxford: Oxford University Press.
              Rawls, John. 1958. Justice as Fairness. Philosophical Review, 67, 164-94.
            • In footnotes/references, spelling should follow the original while punctuation should conform to the style adopted in the body of the text, being either American (double quotation marks outside closing commas and full stops) or English (single quotation marks inside them).For Survey Articles or Debates, option (ii) – i.e., the reference list at the end of the article, together with the corresponding footnote style – is preferred.
        • Nature (Yeah, I know. But as a letter?)
          • Letters are 4 pages, articles are 5
          • ‘For authors’ site map
          • Presubmission enquiries are not required for Articles or Letters, and can be difficult to assess reliably; Nature editors cannot make an absolute commitment to have a contribution refereed before seeing the entire paper.
          • Editorial process
          • Letters
            • Letters are short reports of original research focused on an outstanding finding whose importance means that it will be of interest to scientists in other fields.

              They do not normally exceed 4 pages of Nature, and have no more than 30 references. They begin with a fully referenced paragraph, ideally of about 200 words, but certainly no more than 300 words, aimed at readers in other disciplines. This paragraph starts with a 2-3 sentence basic introduction to the field; followed by a one-sentence statement of the main conclusions starting ‘Here we show’ or equivalent phrase; and finally, 2-3 sentences putting the main findings into general context so it is clear how the results described in the paper have moved the field forwards.

              Please refer to our annotated example to see how the summary paragraph for a Letter should be constructed.

              The rest of the text is typically about 1,500 words long. Any discussion at the end of the text should be as succinct as possible, not repeating previous summary/introduction material, to briefly convey the general relevance of the work.

              Letters typically have 3 or 4 small display items (figures or tables).

              Word counts refer to the text of the paper. References, title, author list and acknowledgements do not have to be included in total word counts

8:30 – 5:30 BRC

  • Just read Gregg’s response to the white paper. He seems to think that TF is just deep NN. Odd
  • Working through fully_connected_feed.py from the TF Mechanics 101 tutorial
  • Multiple returns works in python:
    def placeholder_inputs(batch_size):
        images_placeholder = tf.placeholder(tf.float32, shape=(batch_size,
                                                               Mnist.IMAGE_PIXELS))
        labels_placeholder = tf.placeholder(tf.int32, shape=(batch_size))
        return images_placeholder, labels_placeholder
    
    images_placeholder, labels_placeholder = placeholder_inputs(FLAGS.batch_size)
  • The logit (/ˈloʊdʒɪt/ loh-jit) function is the inverse of the sigmoidal “logistic” function or logistic transform used in mathematics, especially in statistics. When the function’s parameter represents a probability p, the logit function gives the log-odds, or the logarithm of the odds p/(1 − p).[1]
  • In this case,
    logits =  Tensor("softmax_linear/add:0", shape=(100, 10), dtype=float32)
  • Here are some of the other variables:
    images_placeholder =  Tensor("Placeholder:0", shape=(100, 784), dtype=float32)
    labels_placeholder =  Tensor("Placeholder_1:0", shape=(100,), dtype=int32)
    logits =  Tensor("softmax_linear/add:0", shape=(100, 10), dtype=float32)
    loss =  Tensor("xentropy_mean:0", shape=(), dtype=float32)
    train_op =  name: "GradientDescent"
    op: "AssignAdd"
    input: "global_step"
    input: "GradientDescent/value"
    attr {
      key: "T"
      value {
        type: DT_INT32
      }
    }
    attr {
      key: "_class"
      value {
        list {
          s: "loc:@global_step"
        }
      }
    }
    attr {
      key: "use_locking"
      value {
        b: false
      }
    }
    
    eval_correct =  Tensor("Sum:0", shape=(), dtype=int32)
    summary =  Tensor("Merge/MergeSummary:0", shape=(), dtype=string)
  • Note that everything is a Tensor except the train_op, which is declared as follows
    # Add to the Graph the Ops that calculate and apply gradients.
    train_op = Mnist.training(loss, FLAGS.learning_rate)
    print("train_op = ", train_op)
  • It looks like dictionaries are the equivalent of may labeled matrices
    def fill_feed_dict(data_set, images_pl, labels_pl):
        """Fills the feed_dict for training the given step.
        A feed_dict takes the form of:
        feed_dict = {
            : ,
            ....
        }
        Args:
          data_set: The set of images and labels, from input_data.read_data_sets()
          images_pl: The images placeholder, from placeholder_inputs().
          labels_pl: The labels placeholder, from placeholder_inputs().
        Returns:
          feed_dict: The feed dictionary mapping from placeholders to values.
        """
        # Create the feed_dict for the placeholders filled with the next
        # `batch size` examples.
        images_feed, labels_feed = data_set.next_batch(FLAGS.batch_size,
                                                       FLAGS.fake_data)
        feed_dict = {
            images_pl: images_feed,
            labels_pl: labels_feed,
        }
        return feed_dict
  • lookup_ops seems to have the pieces we want. Now I just have to make it run…

Training?

Last-second proposal writing

Phil 3.1.17

It’s March and no new wars! Hooray!

7:00 – 8:00 Research

8:30 – 4:30 BRC

  • More TensorFlow
    • MNIST tutorial – clear, but a LOT of stuff
    • Neural Networks and Deep Learning is an online book referenced in the TF documentation (at least the softmax chapter)
    • A one-hot vector is a vector which is 0 in most dimensions, and 1 in a single dimension. In this case, the nth digit will be represented as a vector which is 1 in the nth dimension. For example, 3 would be [0,0,0,1,0,0,0,0,0,0]. Consequently, mnist.train.labels is a [55000, 10] array of floats.
    • If you want to assign probabilities to an object being one of several different things, softmax is the thing to do, because softmax gives us a list of values between 0 and 1 that add up to 1. Even later on, when we train more sophisticated models, the final step will be a layer of softmax.
    • x = tf.placeholder(tf.float32, [None, 784])

      We represent this as a 2-D tensor of floating-point numbers, with a shape [None, 784]. (Here None means that a dimension can be of any length.)

    • A good explanation of cross-entropy, apparently.
    • tf.reduce_mean
    • Success!!! Here’s the code:
      import tensorflow as tf
      from tensorflow.examples.tutorials.mnist import input_data
      
      mnist = input_data.read_data_sets("MNIST_data/", one_hot=True)
      
      x = tf.placeholder(tf.float32, [None, 784])
      
      W = tf.Variable(tf.zeros([784, 10]))
      b = tf.Variable(tf.zeros([10]))
      
      y = tf.nn.softmax(tf.matmul(x, W) + b)
      
      y_ = tf.placeholder(tf.float32, [None, 10]) #note that y_ means 'y prme'
      
      cross_entropy = tf.reduce_mean(-tf.reduce_sum(y_ * tf.log(y), reduction_indices=[1]))
      
      train_step = tf.train.GradientDescentOptimizer(0.5).minimize(cross_entropy)
      
      sess = tf.InteractiveSession()
      
      tf.global_variables_initializer().run()
      
      for _ in range(1000):
          batch_xs, batch_ys = mnist.train.next_batch(100)
          sess.run(train_step, feed_dict={x: batch_xs, y_: batch_ys})
      
      correct_prediction = tf.equal(tf.argmax(y,1), tf.argmax(y_,1))
      accuracy = tf.reduce_mean(tf.cast(correct_prediction, tf.float32))
      print(sess.run(accuracy, feed_dict={x: mnist.test.images, y_: mnist.test.labels}))
    • And here are the results:
      C:\Users\philip.feldman\AppData\Local\Programs\Python\Python35\python.exe C:/Development/Sandboxes/TensorflowPlayground/HelloPackage/MNIST_tutorial.py
      Extracting MNIST_data/train-images-idx3-ubyte.gz
      Extracting MNIST_data/train-labels-idx1-ubyte.gz
      Extracting MNIST_data/t10k-images-idx3-ubyte.gz
      Extracting MNIST_data/t10k-labels-idx1-ubyte.gz
      
      0.9192
    • Working on the advanced tutorial. Fixed fully_connected_feed.py to work with local data.
    • And then my brain died

Phil 2.28.17

7:00 – 8:30 Research

  • Sent a note to Don about getting together on Thursday
  • Added to the list of journals and conferences. Included the Journal of Political Philosophy, which is where The Law of GP was originally published

9:00 – 4:30 BRC

  • Installing Tensorflow as per the instructions for CUDA and Anaconda
    • May need to install Python 2.7 version due to TF incompatibility with prebuilt python distros
    • Looks like I need visual studio for CUDA support, which is excessive. Going to try the CPU-only version
    • Installing Anaconda3-4.3.0.1-Windows-x86_64.exe.  Nope, based on Aaron’s experiences, I’m going to install natively
  • Tensorflow native pip installation
    • Uninstalled old Python
    • Installed python-3.5.2-amd64.exe from here
    • Did the cpu install:
       pip3 install --upgrade tensorflow
    • Ran the ‘hello world’ program
      import tensorflow as tf
      hello = tf.constant('Hello, TensorFlow!')
      sess = tf.Session()
      print(sess.run(hello))
    • Success!!!
      E c:\tf_jenkins\home\workspace\release-win\device\cpu\os\windows\tensorflow\core\framework\op_kernel.cc:943] OpKernel ('op: "BestSplits" device_type: "CPU"') for unknown op: BestSplits
      E c:\tf_jenkins\home\workspace\release-win\device\cpu\os\windows\tensorflow\core\framework\op_kernel.cc:943] OpKernel ('op: "CountExtremelyRandomStats" device_type: "CPU"') for unknown op: CountExtremelyRandomStats
      E c:\tf_jenkins\home\workspace\release-win\device\cpu\os\windows\tensorflow\core\framework\op_kernel.cc:943] OpKernel ('op: "FinishedNodes" device_type: "CPU"') for unknown op: FinishedNodes
      E c:\tf_jenkins\home\workspace\release-win\device\cpu\os\windows\tensorflow\core\framework\op_kernel.cc:943] OpKernel ('op: "GrowTree" device_type: "CPU"') for unknown op: GrowTree
      E c:\tf_jenkins\home\workspace\release-win\device\cpu\os\windows\tensorflow\core\framework\op_kernel.cc:943] OpKernel ('op: "ReinterpretStringToFloat" device_type: "CPU"') for unknown op: ReinterpretStringToFloat
      E c:\tf_jenkins\home\workspace\release-win\device\cpu\os\windows\tensorflow\core\framework\op_kernel.cc:943] OpKernel ('op: "SampleInputs" device_type: "CPU"') for unknown op: SampleInputs
      E c:\tf_jenkins\home\workspace\release-win\device\cpu\os\windows\tensorflow\core\framework\op_kernel.cc:943] OpKernel ('op: "ScatterAddNdim" device_type: "CPU"') for unknown op: ScatterAddNdim
      E c:\tf_jenkins\home\workspace\release-win\device\cpu\os\windows\tensorflow\core\framework\op_kernel.cc:943] OpKernel ('op: "TopNInsert" device_type: "CPU"') for unknown op: TopNInsert
      E c:\tf_jenkins\home\workspace\release-win\device\cpu\os\windows\tensorflow\core\framework\op_kernel.cc:943] OpKernel ('op: "TopNRemove" device_type: "CPU"') for unknown op: TopNRemove
      E c:\tf_jenkins\home\workspace\release-win\device\cpu\os\windows\tensorflow\core\framework\op_kernel.cc:943] OpKernel ('op: "TreePredictions" device_type: "CPU"') for unknown op: TreePredictions
      E c:\tf_jenkins\home\workspace\release-win\device\cpu\os\windows\tensorflow\core\framework\op_kernel.cc:943] OpKernel ('op: "UpdateFertileSlots" device_type: "CPU"') for unknown op: UpdateFertileSlots
      b'Hello, Tensorflow!'
      >>>
    • The errors are some kind of cruft that has been fixed in the nightly build as per this thread
    • Got my new Python running in IntelliJ
    • Working through the tutorials. So far so good, and the support for matrices is very nice
    • Some Tensorflow stuff from O’Reilly
    • Some proposal work slinging text on cognitive computing

Phil 2.27.17

7:00 – 8:30 Research

  • Call Senate, house about CBP, SCOTUS, etc
  • Add Antibelief, Leader, etc. mentions to Future work

9:00 – 6:00 BRC

Phil 2.24.17

7:00 – 8:00 Research

8:30 – 4:30 BRC

Phil 2.22.17

7:00 – 2:00 Research

  • Starting full paper
  • Finished porting abstract into gdocs
  • Working on adding the DTW work. Building charts. Lots of charts.

2:00 – 6:00 BRC

  • Worked with Aaron on accessing the classifier microservice
  • Writing up DTW as a mechanism for predicting behaviors
  • Found my old scripting engine code. Need to download and check

Phil 2.21.17

7:00 – 12:00 Research

import net.sf.javaml.distance.fastdtw.dtw.FastDTW;
import net.sf.javaml.distance.fastdtw.timeseries.TimeSeries;
import net.sf.javaml.distance.fastdtw.timeseries.TimeSeriesPoint;

TimeSeries tsI = new TimeSeries(1);
TimeSeries tsJ = new TimeSeries(1);

TimeSeriesPoint tspI;
TimeSeriesPoint tspJ;

double t = 0;
double offset = 0.0;
double amplitude = 2.0;
double step = 0.1;
while(t < 10) {
    double[] v1 = {Math.sin(t)};
    double[] v2 = {Math.sin(t+offset)*amplitude};
    tspI = new TimeSeriesPoint(v1);
    tspJ = new TimeSeriesPoint(v2);
    tsI.addLast(t, tspI);
    tsJ.addLast(t, tspJ);

    t += step;
}

System.out.println("FastDTW.getWarpDistBetween(tsI, tsJ) = "+FastDTW.getWarpDistBetween(tsI, tsJ));
FastDTW.getWarpDistBetween(tsI, tsJ) = 46.33334518229166
  • Note that the measure can be through all of the dimensions, so this may take some refactoring
  • Next step is to add this to the FlockRecorder class and output to excel and ARFF. I think this should replace the ‘deltas’ outputs. Done!
  • Running DBSCAN clustering in WEKA on the outputs
    • All Exploit – Social Radius = 0: All NOISE
    • All Exploit – Social Radius = 0.1 ALL NOISE
    • All Exploit – Social Radius = 0.2 (32 NOISE)
      === Model and evaluation on training set ===
      
      Clustered Instances
      
      0       68 (100%)
      
      Unclustered instances : 32
      
      Class attribute: AgentBias_
      Classes to Clusters:
      
        0  -- assigned to cluster
       68 | EXPLOITER
      
      Cluster 0 -- EXPLOITER
      
      Incorrectly clustered instances :	0.0	  0      %
    • All Exploit – Social Radius = 0.4 (86 NOISE)
      == Model and evaluation on training set ===
      
      Clustered Instances
      
      0       14 (100%)
      
      Unclustered instances : 86
      
      Class attribute: AgentBias_
      Classes to Clusters:
      
        0  -- assigned to cluster
       14 | EXPLOITER
      
      Cluster 0 -- EXPLOITER
      
      Incorrectly clustered instances :	0.0	  0      %
    • All Exploit – Social Radius = 0.8 (41 NOISE)
      === Model and evaluation on training set ===
      
      Clustered Instances
      
      0       45 ( 76%)
      1        7 ( 12%)
      2        7 ( 12%)
      
      Unclustered instances : 41
      
      Class attribute: AgentBias_
      Classes to Clusters:
      
        0  1  2  -- assigned to cluster
       45  7  7 | EXPLOITER
      
      Cluster 0 -- EXPLOITER
      Cluster 1 -- No class
      Cluster 2 -- No class
      
      Incorrectly clustered instances :	14.0	 14      %
    • All Exploit – Social Radius = 1.6 (51 NOISE)
      === Model and evaluation on training set ===
      
      Clustered Instances
      
      0       49 (100%)
      
      Unclustered instances : 51
      
      Class attribute: AgentBias_
      Classes to Clusters:
      
        0  -- assigned to cluster
       49 | EXPLOITER
      
      Cluster 0 -- EXPLOITER
      
      Incorrectly clustered instances :	0.0	  0      %
    • All Exploit – Social Radius = 3.2 (9 NOISE)
      === Model and evaluation on training set ===
      
      Clustered Instances 
      
      0       91 (100%)
      
      Unclustered instances : 9
      
      Class attribute: AgentBias_
      Classes to Clusters:
      
        0  -- assigned to cluster
       91 | EXPLOITER
      
      Cluster 0 -- EXPLOITER
      
      Incorrectly clustered instances :	0.0	  0      %
    • All Exploit – Social Radius = 6.4 (8 NOISE)
      === Model and evaluation on training set ===
      
      Clustered Instances
      
      0       86 ( 93%)
      1        6 (  7%)
      
      Unclustered instances : 8
      
      Class attribute: AgentBias_
      Classes to Clusters:
      
        0  1  -- assigned to cluster
       86  6 | EXPLOITER
      
      Cluster 0 -- EXPLOITER
      Cluster 1 -- No class
      
      Incorrectly clustered instances :	6.0	  6      %
      
    • All Exploit – Social Radius = 10
      === Model and evaluation on training set ===
      
      Clustered Instances
      
      0       82 ( 91%)
      1        8 (  9%)
      
      Unclustered instances : 10
      
      Class attribute: AgentBias_
      Classes to Clusters:
      
        0  1  -- assigned to cluster
       82  8 | EXPLOITER
      
      Cluster 0 -- EXPLOITER
      Cluster 1 -- No class
      
      Incorrectly clustered instances :	8.0	  8      %
  • So what this all means is that the DTW produces reasonable data that can be used for clustering. The results seem to match the plots. I think I can write this up now…

12:00 – 5:00 BRC

  • Clustering discussions with Aaron
  • GEM Meeting

Phil 2.20.17

7:00 – 11:00 Research

  • PathNet article and paper. Using genetic techniques to produce better NN systems. GAs are treated like gradient descent. Which makes sense, as gradient descent and hillclimbing are pretty much the same thing
    • “Since scientists started building and training neural networks, Transfer Learning has been the main bottleneck. Transfer Learning is the ability of an AI to learn from different tasks and apply its pre-learned knowledge to a completely new task. It is implicit that with this precedent knowledge, the AI will perform better and train faster than de novo neural networks on the new task.”
  • Adding angle and mean deltas. Interesting results, but still not sure on the best approach to classify…
  • Newest version is at philfeldman.com/GroupPolarization
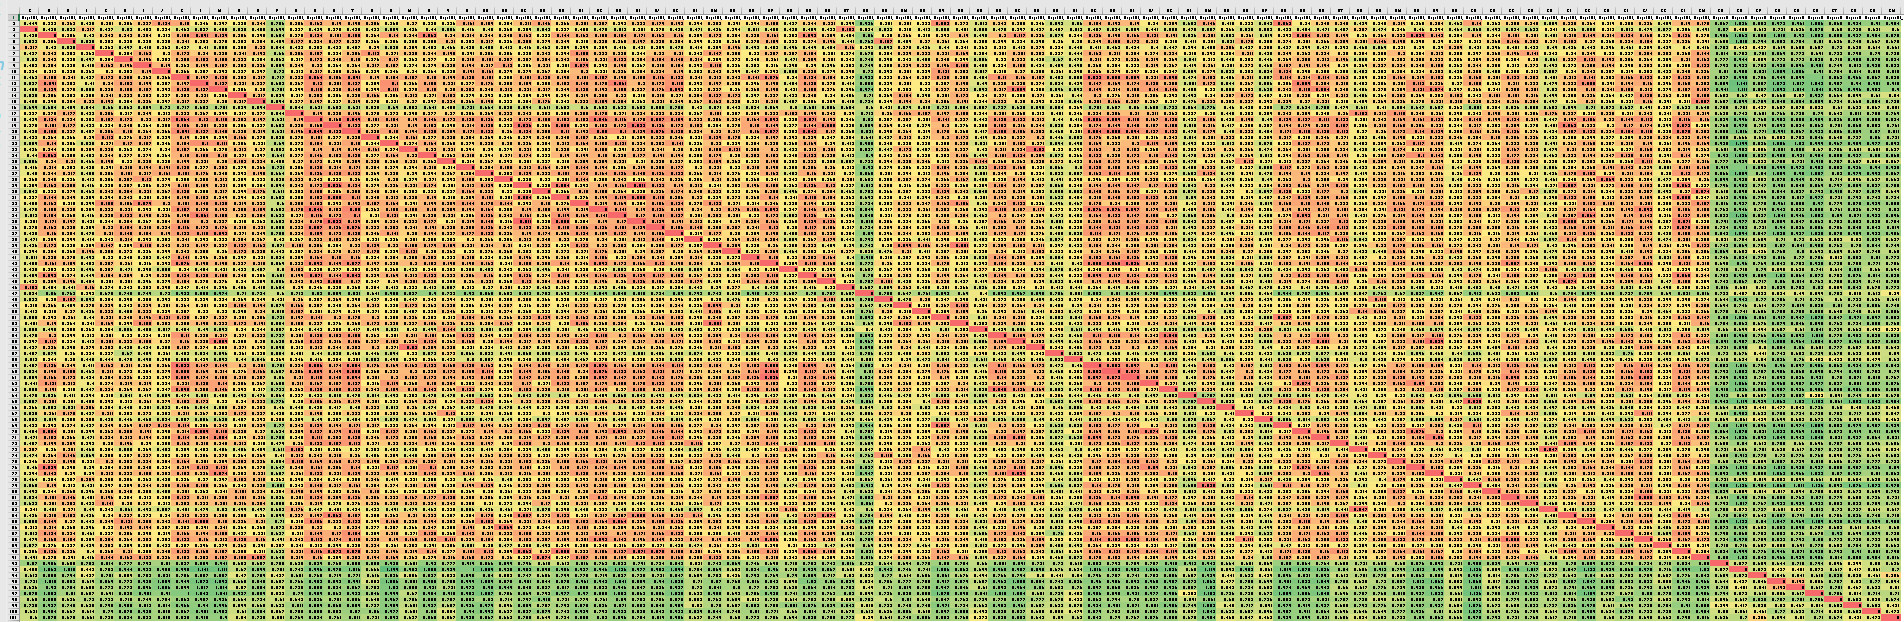
  • So here’s a pretty typical population. It’s 10% Explorer, 90% Exploiter. Exploit social influence radius is 0.2. These settings produce an orbiting flock. Between-group interaction is allowed, so This is a grid where the accumulated relationship of each agent to every other agent is shown. Red is closest, green is farthestcolorizedpositions You can see the different populations pretty well. One thing that isn’t that obvious is that exploiters are on average slightly closer to each other than to exploiters.
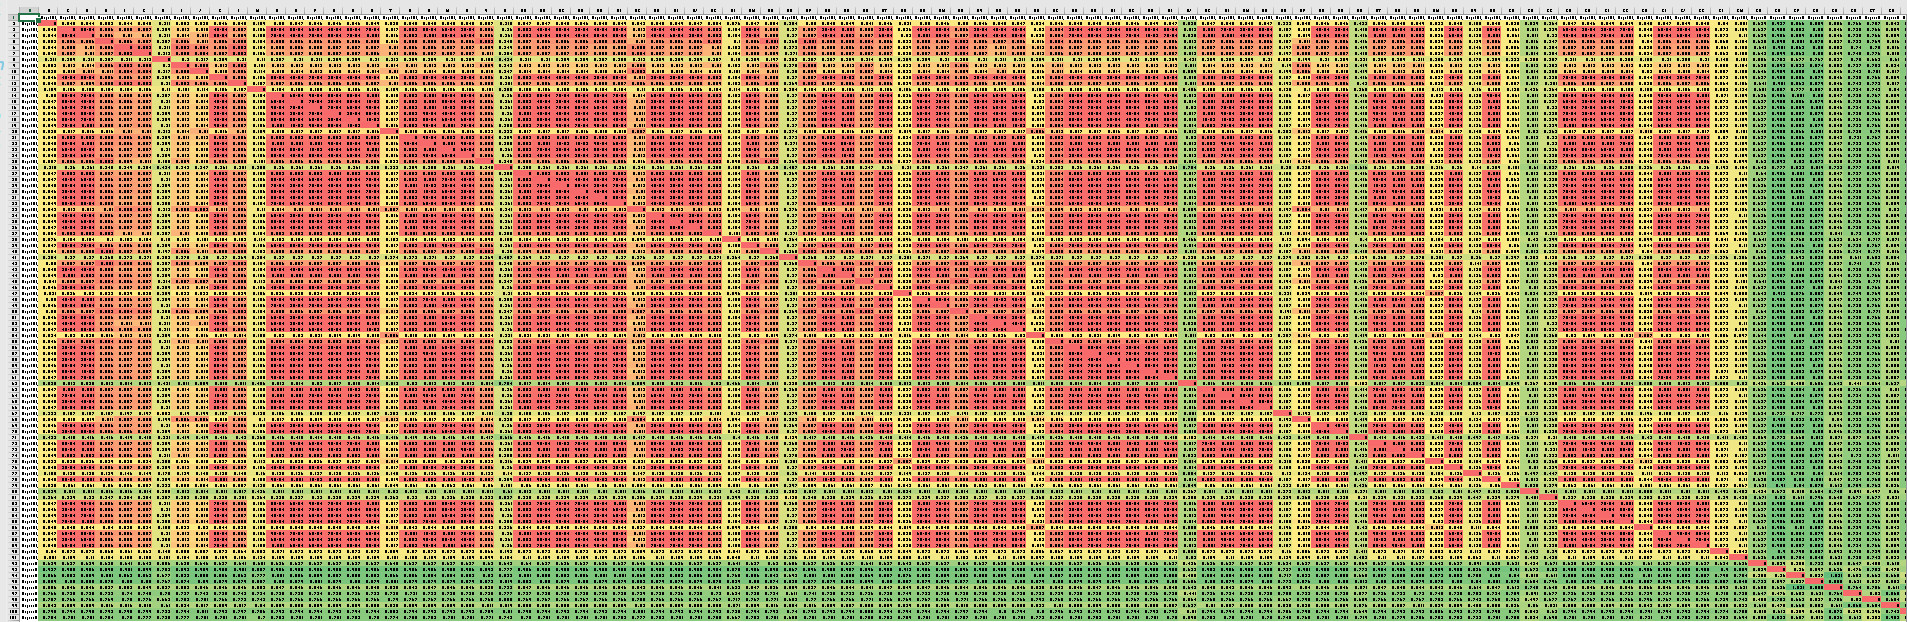
  • A more extreme example is where the Exploit influence distance is 10: colorizedpositions2 These tables show just relative position when compared to the origin.
  • Although I can’t figure out how to classify using this data, clustering works pretty well. This is Canopy (WEKA) on the top dataset above:
    === Run information ===
    
    Scheme: weka.clusterers.Canopy -N -1 -max-candidates 100 -periodic-pruning 10000 -min-density 2.0 -t2 -1.0 -t1 -1.25 -S 1
    Relation: ORIGIN_POSITION_DELTA
    Instances: 100
    Attributes: 102
    [list of attributes omitted]
    Test mode: Classes to clusters evaluation on training data
    
    === Clustering model (full training set) ===
    
    Canopy clustering
    =================
    
    Number of canopies (cluster centers) found: 2
    T2 radius: 3.137
    T1 radius: 3.922
    
    Cluster 0: 0.283631,0.443357,0.240249,0.280277,0.396611,0.258673,0.28608,0.27558,0.312295,0.215801,0.249255,0.25779,0.280719,0.273191,0.58818,0.258901,0.196191,0.240405,0.201927,0.273491,0.271862,0.266807,0.249377,0.269756,0.265874,0.252873,0.299417,0.244208,0.284257,0.253868,0.234348,0.213578,0.242031,0.248292,0.215259,0.236993,0.301843,0.245444,0.282464,0.290885,0.216585,0.375846,0.223493,0.278251,0.375965,0.764462,0.338657,0.280672,0.316447,0.261622,0.265026,0.436098,0.246442,0.246887,0.289306,0.470806,0.43541,0.209845,0.220971,0.21506,0.247576,0.249173,0.468053,0.28907,0.418987,0.293851,0.452858,0.267638,0.243671,0.248868,0.242674,0.371534,0.29843,0.221506,0.25575,0.242182,0.335877,0.28386,0.303986,0.235298,0.282083,0.427425,0.26635,0.251009,0.304134,0.281157,0.212644,0.367693,0.222213,0.247862,0.780248,0.894699,0.713413,0.865287,0.826024,0.868741,0.757008,0.807287,0.785141,0.756071,{88}
    Cluster 1: 0.919922,0.669721,0.908035,0.73578,0.591465,0.752733,0.774358,0.826861,0.84364,0.884803,0.939301,0.958981,0.629587,0.76459,0.545587,0.715267,0.853073,0.803545,0.851979,0.693952,0.954557,0.703606,0.897206,0.698297,0.926263,0.91898,0.733686,0.818759,0.763319,0.776199,0.843167,0.811708,0.903011,0.814435,0.804113,0.916336,0.639919,0.779399,0.663897,0.754696,0.77482,0.682512,0.832556,0.764008,0.703999,0.513612,0.693526,0.734279,0.723504,0.903016,0.777757,0.597915,0.86509,0.900357,0.724636,0.648915,0.577278,0.883327,0.828117,0.813873,0.860062,0.915821,0.684886,0.979451,0.556747,0.667678,0.556487,0.941671,0.898276,0.902846,0.686763,0.664381,0.709607,0.706246,0.890753,0.898794,0.588379,1.001214,0.625244,0.761188,0.828436,0.661864,0.759379,0.944355,0.728272,0.764909,0.761139,0.65028,0.845547,0.87213,0.586679,0.500194,0.498893,0.513267,0.493026,0.58192,0.620756,0.469854,0.540532,0.496272,{12}
    
    Time taken to build model (full training data) : 0.03 seconds
    
    === Model and evaluation on training set ===
    
    Clustered Instances
    
    0 88 ( 88%)
    1 12 ( 12%)
    
    Class attribute: AgentBias_
    Classes to Clusters:
    
    0 1 -- assigned to cluster
    0 10 | EXPLORER
    88 2 | EXPLOITER
    
    Cluster 0 -- EXPLOITER
    Cluster 1 -- EXPLORER
    
    Incorrectly clustered instances : 2.0 2 %
  • The next analyses is on the second dataset. They are essentially the same, even though the differences are more dramatic (the tight clusters are very tight
    === Run information ===
    
    Scheme:       weka.clusterers.Canopy -N -1 -max-candidates 100 -periodic-pruning 10000 -min-density 2.0 -t2 -1.0 -t1 -1.25 -S 1
    Relation:     ORIGIN_POSITION_DELTA
    Instances:    100
    Attributes:   102
                  [list of attributes omitted]
    Test mode:    Classes to clusters evaluation on training data
    
    === Clustering model (full training set) ===
    
    
    Canopy clustering
    =================
    
    Number of canopies (cluster centers) found: 2
    T2 radius: 3.438     
    T1 radius: 4.297     
    
    Cluster 0: 0.085848,0.050964,0.0513,0.053288,0.05439,0.054653,0.21758,0.057725,0.058775,0.050894,0.053768,0.130821,0.051098,0.050923,0.051115,0.050893,0.051012,0.051009,0.060649,0.051454,0.051089,0.051032,0.050894,0.053364,0.276684,0.051857,0.050984,0.050942,0.0509,0.050952,0.051025,0.056953,0.050914,0.050962,0.050903,0.052129,0.128196,0.051023,0.054222,0.274438,0.053978,0.050934,0.051124,0.054563,0.050995,0.074289,0.051077,0.05094,0.053644,0.050941,0.051343,0.050967,0.062704,0.052333,0.050936,0.051013,0.050922,0.051007,0.051038,0.050899,0.501239,0.051574,0.051005,0.050898,0.050944,0.204398,0.06076,0.050947,0.050904,0.408553,0.051263,0.0511,0.051574,0.069173,0.050997,0.162314,0.051353,0.096523,0.498648,0.339103,0.051125,0.050888,0.051002,0.051124,0.080711,0.05105,0.051024,0.050988,0.100492,0.132793,0.630178,0.882598,0.832132,0.86452,0.55151,0.729317,0.755526,0.513822,0.782104,0.768836,{92} 
    Cluster 1: 0.799117,0.793729,0.79643,0.7929,0.797843,0.797642,0.709935,0.78817,0.805937,0.794095,0.7972,0.76062,0.793743,0.79418,0.794846,0.794247,0.794677,0.793599,0.800359,0.794787,0.793849,0.793805,0.793613,0.784762,0.774656,0.79547,0.794308,0.793527,0.794406,0.793292,0.793513,0.800151,0.793775,0.793652,0.794123,0.793645,0.73331,0.794506,0.788542,0.710244,0.793332,0.793313,0.794184,0.801119,0.79448,0.802416,0.793669,0.7947,0.794813,0.794533,0.796484,0.794512,0.797614,0.794607,0.793716,0.793642,0.793548,0.794789,0.793551,0.793989,0.539133,0.79391,0.793443,0.793969,0.794472,0.715896,0.790956,0.794494,0.794293,0.678147,0.79434,0.793611,0.794221,0.802197,0.793753,0.759132,0.794164,0.798071,0.55929,0.698333,0.79444,0.79424,0.793585,0.793581,0.779958,0.79394,0.793567,0.794795,0.764686,0.754727,0.482214,0.518683,0.434538,0.501648,0.790616,0.4855,0.464554,0.691735,0.405411,0.496892,{8} 


    Time taken to build model (full training data) : 0.01 seconds
    
    === Model and evaluation on training set ===
    
    Clustered Instances
    
    0       88 ( 88%)
    1       12 ( 12%)
    
    
    Class attribute: AgentBias_
    Classes to Clusters:
    
      0  1  -- assigned to cluster
      0 10 | EXPLORER
     88  2 | EXPLOITER
    
    Cluster 0 -- EXPLOITER
    Cluster 1 -- EXPLORER
    
    Incorrectly clustered instances :	2.0	  2      %
  • Online clustering, fear and uncertainty in Egypt’s transition (Published today). Wow. Downloaded

11:00 – 6:00 BRC

  • Spent the rest of the day working on the CHIMERA paper with Aaron