
Tasks
- Groceries! Done
- Goodwill – done
- Nag Aaron for paperwork – done
SBIRs
- 10:00 Ron’s meeting – postponed
- Now that I have the displays up and running, either get started on UMAP or play with HDBSCAN
- I moved all the Plotly code into a DfScatter3D class, since the clusterers and reducers shouldn’t have to care about rendering.
- I created a python script that calls HDBSCAN on the same data I’ve been using but without the assigned clustering. It’s really easy to use:
    df = pd.DataFrame(l)
    blobs = df.values.tolist()
    clusterer = hdbscan.HDBSCAN()
    clusterer.fit(blobs)
    df['cluster'] = clusterer.labels_
- And that gives results that are almost as good as the assigned values:
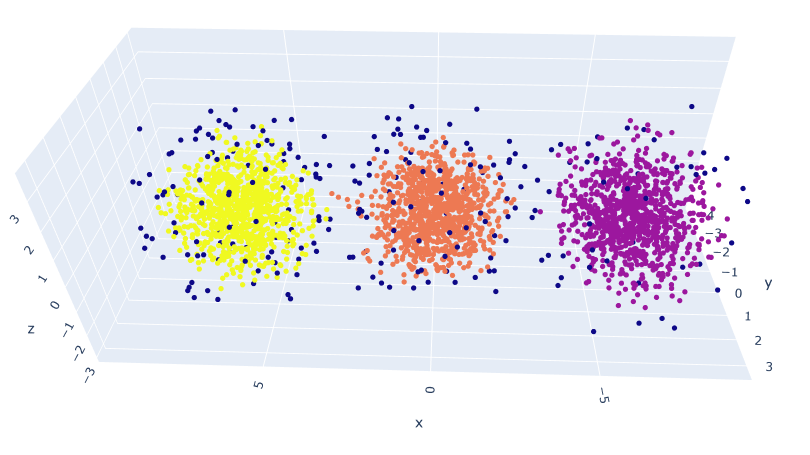
- These results are with the default values. Note that the points that can’t be assigned have dark coloring
- The next thing I’ll do is create a line along the X axis and use hdbscan.approximate_predict(clusterer, x_axis_points) to see where they get assigned.
- It’s the same sort of patterns as before, though you do have to concat the two dataframes together for proper rendering:
    df2 = pd.DataFrame(l)
    test_points = df2.values.tolist()
    test_labels, strengths = hdbscan.approximate_predict(clusterer, test_points)
    df2['cluster'] = test_labels
    df3 = pd.concat([df, df2])
- Which gives us this:
UMBC
- 3:00 Alden
