
7:00 – 8:00
- Systematic exploration of unsupervised methods for mapping behavior
- Thinking about the stories I can tell with the GP sim.
- Start together with same settings.
- Disconnect
- Slide exploit to max
- Need to download blog entries
- Working on graphing. Success!!!!!
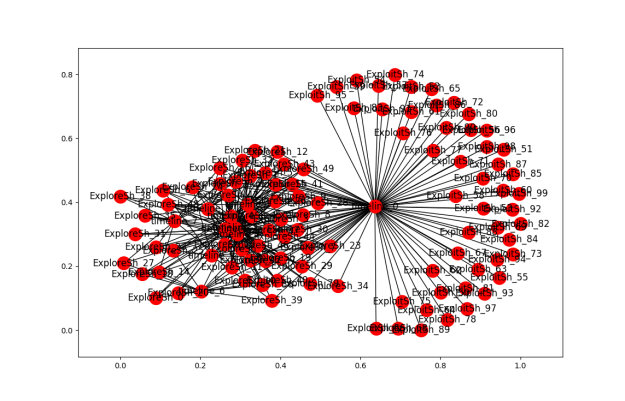 Now I need to discriminate agents from clusters, and exploit from explore. But this shows polarized vs. diverse clustering. I’m pretty sure I can get all kinds of statistics out of this too!
 - Better version. Ran all the permutations:
 explore_1.6_exploit_3.2_ran 04_14_17-08_38_48. Green are clusters, Red are Exploit, Blue are Explore
- Need to make the line width based on the time spent in the cluster, and the cluster size a function of its lifespan


9:00 – 5:00 BRC
- Working on showing where the data broke. Looks like Talend
- For future referrence, How to turn a dict of rows into a DataFrame and then how to access all the parts:
import pandas as pd d1 = {'one':1.1, 'two':2.1, 'three':3.1} d2 = {'one':1.2, 'three':3.2} d3 = {'one':1.3, 'two':2.3, 'three':3.3} rows = {'row1':d1, 'row2':d2} rows['row3'] = d3 df = pd.DataFrame(rows) df = df.transpose() print(df) for index, row in df.iterrows(): print(index) for key, val in row.iteritems(): print("{0}:{1}".format(key, val)) - Helped Aaron with the writeups
- And it turns out that all the work I did “could be done in an hour”. So back to clustering and AI work. If there is a problem with the data, I know that it works with the test data. Others can figure out where the problem is, since they can handle it so quickly.
