No research this morning. Had flu-like symptoms from midnight to 2:00 or so and slept in. Considering how bad I felt last night, I’m pleasantly surprised to feel good enough to get into work at 9:00.
I did take the Superpedestrian wheel out (yes, as I was getting sick) for my 18 mile hilly loop. It took around an hour and performed really well. It just flattens hills, while behaving like a normal bike at all other times.
Google Says Its Job Is to Promote Climate Change Conspiracy Theories
9:00 – 4:00 BRC
- My fix from yesterday doesn’t work on Aaron’s machine. Verified that it works on any of my cmd-line interfaces. Weird.
- Testing to see if my Excel has been fixed. Nope.
- More work on getting Python imports to behave. All written up here.
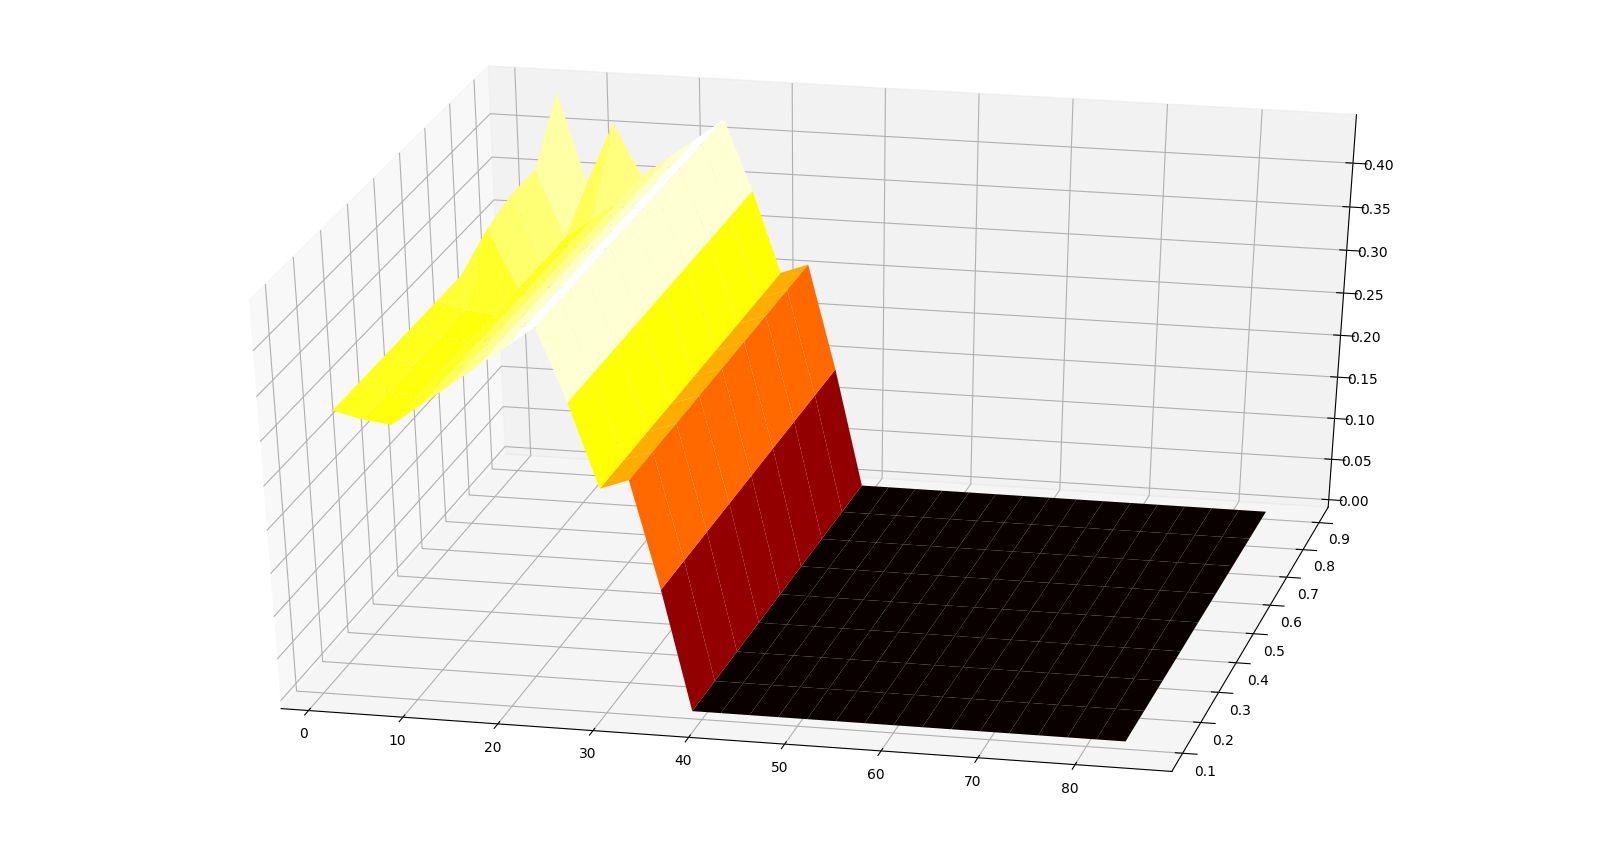
- Got the data sheets working with the plots:

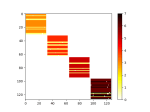
plt.imshow(df, extent=[3, points/3, 0.9, 0.1], aspect='auto', cmap=plt.cm.get_cmap("hot"))
plt.colorbar()
This took a while to figure out. The X, Y arrays are used to create the mesh. The df.as_matrix() contains the Z values. Just make sure that row size and column size match!
fig = plt.figure() ax = Axes3D(fig) X = co.get_min_cluster_array() Y = co.get_eps_array() X, Y = np.meshgrid(X, Y) Z = df.as_matrix() ax.plot_surface(X, Y, Z, cmap=plt.cm.get_cmap("hot")) plt.show() - Next is to save the best cluster run with its EPS and cluster size
- Wound up just using the number of clusters for now. That seems to be a better fitness test. Also, I discovered that all Dataframes are references, so it’s important to make a deep copy if you’re trying to keep the best one around! Here are the best results so far:
-