
8:00 – 4:00 SR
- Possibly a good book to get? https://www.ng-book.com/
- Working on getting regression to predict upper and lower bounds
- Working out the structure of the dataFormat and dataProvider Objects
- dataFormat example
this.dataFormat = { // might add 2D/3d, dynamic/static, etc. goals: "area", obligations:"area", pm_actuals:"bar", facts:"bar", pm_future:"area", facts_future:"area" }; - Matching dataProvider example. Note the _mappings array and the fact that all items have a min/max value as well as a chart-wide minmax (no Z in this case)
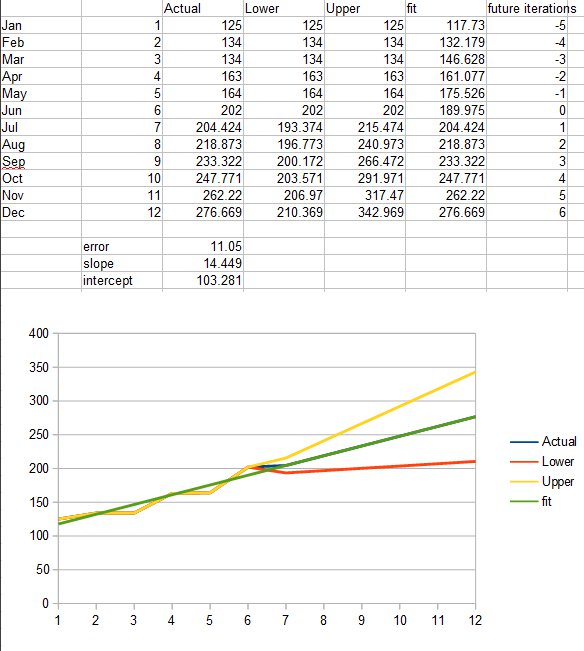
this.dataProvider = { _type:'XY', // RAH (Radius Angle Height) RAE (Radius Azimuth Elevation), XYZ, etc. _min_max:{xmin:0.00, xmax:11.00, ymin:0.00, ymax:3135.30}, _mappings:[{Jan:0, Feb:1, Mar:2, Apr:3, May:4, Jun:5, Jul:6, Aug:7, Sep:8, Oct:9, Nov:10, Dec:11}], goals:{Jan:{min:0, max:1000.00}, Feb:{min:0, max:1100.00}, Mar:{min:0, max:1210.00}, Apr:{min:0, max:1331.00}, May:{min:0, max:1464.10}, Jun:{min:0, max:1610.51}, Jul:{min:0, max:1771.56}, Aug:{min:0, max:1948.72}, Sep:{min:0, max:2143.59}, Oct:{min:0, max:2357.95}, Nov:{min:0, max:2593.74}, Dec:{min:0, max:2853.12}}, obligations:{Jan:{min:0, max:500.00}, Feb:{min:0, max:600.00}, Mar:{min:0, max:720.00}, Apr:{min:0, max:864.00}, May:{min:0, max:1036.80}, Jun:{min:0, max:1244.16}, Jul:{min:0, max:1492.99}, Aug:{min:0, max:1791.59}, Sep:{min:0, max:2149.91}, Oct:{min:0, max:2579.89}, Nov:{min:0, max:3095.87}, Dec:{min:0, max:3715.04}}, pm_actuals:{Jan:{min:0, max:250.00}, Feb:{min:0, max:341.39}, Mar:{min:0, max:495.27}, Apr:{min:0, max:618.30}, May:{min:0, max:923.08}, Jun:{min:0, max:1318.68}}, facts:{Jan:{min:0, max:125.00}, Feb:{min:0, max:134.17}, Mar:{min:0, max:134.31}, Apr:{min:0, max:163.00}, May:{min:0, max:164.36}, Jun:{min:0, max:202.29}}, future_pm_actuals:{Jun:{min:1318.68, max:1318.68}, Jul:{min:1257.91, max:1499.96}, Aug:{min:1342.92, max:1827.03}, Sep:{min:1427.94, max:2154.10}, Oct:{min:1512.96, max:2481.16}, Nov:{min:1597.97, max:2808.23}, Dec:{min:1682.99, max:3135.30}}, future_facts:{Jun:{min:202.29, max:202.29}, Jul:{min:193.38, max:215.48}, Aug:{min:196.77, max:240.99}, Sep:{min:200.17, max:266.49}, Oct:{min:203.57, max:291.99}, Nov:{min:206.96, max:317.50}, Dec:{min:210.36, max:343.00}} }; - In excel, the results look like the following. Now working on incorporating into the graphing system
- Setting up a method to calculate the screen positions of the data points based on the dataProvider. Got margins, datagrids and areaCharts working. BarCharts are next. I need to think about how to cluster the bars. I’ll also need to add additional DataPoints when the botom axis is not (zero? horizontal?)

